In den letzten Wochen sind zwei Interviews veröffentlicht worden, die die DOAG mit mir im Rahmen der jährlichen DOAG Konferenz in Nürnberg durchgeführt hat.
Das erste stammt noch von der DOAG Konferenz 2015 und bezieht sich auf meinen damaligen Vortrag über die neuen Parallel Execution Features von Oracle 12c:
DOAG.tv Interview 2015
Das zweite ist von der diesjährigen DOAG Konferenz und bezieht sich auf meine Performance-Tests der Oracle Database Cloud und dem dazugehörigen Vortrag:
DOAG.tv Interview 2016
Die Interviews dauern jeweils nur wenige Minuten, gehen also nur in wenigen Stichpunkten auf die jeweiligen Themen ein.
Tuesday, December 27, 2016
Tuesday, December 13, 2016
Oracle ACE Director Alumni Status
I've recently requested to be removed from the Oracle ACE program and move to the "Alumni" status.
I've already felt for a quite a while now that my area of expertise and interest as well as my public profile (no Twitter etc.) is no longer really a good fit to the ACE program.
The most recent changes to the ACE program then just have made my decision easier to step back.
All the best to the ACE program and thanks for the support during the last eight years!
This decision won't really influence what I'll do in the future - I'll continue to publish notes and videos about things I find interesting about Oracle database technology, the same way I did before - probably with a little less pressure to maintain a certain level of output.
Monday, December 12, 2016
Queue-based Concurrent Stats Prototype Implementation
This is just a prototype of a queue-based concurrent statistics implementation - using the same basic implementation I've used a a couple of years ago to create indexes concurrently.
There are reasons why such an implementation might be useful - in 11.2.0.x the built-in Concurrent Stats feature might turn out to be not really that efficient by creating lots of jobs that potentially attempt to gather statistics for different sub-objects of the same table at the same time - which can lead to massive contention on Library Cache level due to the exclusive Library Cache locks required by DDL / DBMS_STATS calls.
In 12.1 the Concurrent Stats feature obviously got a major re-write by using some more intelligent processing what and how should be processed concurrently - some of the details are exposed via the new view DBA_OPTSTAT_OPERATION_TASKS, but again I've seen it running lots of very small jobs serially one of the other in the main session which can be a performance problem if the sheer number of objects to analyze is huge.
This prototype here tries to work around these problems by using a queue-based approach for true concurrent processing in combination with an attempt to use some "intelligent" ordering of the objects to analyze in the hope to minimize contention on Library Cache level.
This prototype determines the objects to gather statistics on by calling DBMS_STATS.GATHER_DATABASE_STATS using one of the available LIST* options - so it's supposed to replace a call to GATHER_DATABASE_STATS or the built-in default nightly statistics job.
The jobs for concurrent stats gathering are created using DBMS_SCHEDULER and a custom job class, which offers the feature of binding the jobs to a specific service, which can come handy if you for example want these jobs only to execute on certain node(s) in a RAC cluster database.
It comes with the following (known) limitations:
- The current implementation offers only rudimentary logging to a very simple log table, which also gets truncated at the start of each run, so no history from previous runs gets retained. In 12c this is not such an issue since DBA_OPTSTAT_OPERATION_TASKS contains a lot of details for each individual stats gathering call.
- Currently only objects of type TABLE returned by GATHER_DATABASE_STATS are considered assuming the CASCADE option will take care of any indexes to gather statistics for
- The default behaviour attempts to make use of all available CPUs of a single node by starting as many threads as defined via CPU_COUNT. If you explicitly specify the number of concurrent threads the default behaviour is to use a DEGREE (or DOP) per gather stats operation that again makes use of all available CPU resources by using a DEGREE = CPU_COUNT divided by number_of_threads. If you don't want that you will have to specify the DEGREE / DOP explicitly, too
- I haven't spend time to investigate how this behaves with regards to incremental statistics - since it's possible that GLOBAL and (sub-)partition statistics of the same object get gathered in different jobs, potentially at the same time and in random order (so GLOBAL prior to partition for example) the outcome and behaviour with incremental statistics turned on could be a problem
More details can be found in the comments section of the code, in particular what privileges might be required and how you could replace the default statistics job if desired.
The script provided includes a de-installation and installation part of the code. All that needs to be called then to start a database-wide gather statistics processing is the main entry point "pk_stats_concurrent.stats_concurrent" using any optional parameters as desired - consider in particular the parameters to control the number of threads and the intra-operation DOP as just outlined. See the code comments for a detailed description of the available parameters.
--------------------------------------------------------------------------------
--
-- Script:       pk_stats_concurrent.sql
--
-- Author:       Randolf Geist
--
-- Copyright:    http://oracle-randolf.blogspot.com
--
-- Purpose:      A queue based concurrent stats implementation - installation script
--
-- Usage:        @pk_stats_concurrent
--
--               The script will first drop all objects (can be skipped)
--
--               And then attempt to create the objects required (can be skipped)
--
--------------------------------------------------------------------------------

spool pk_stats_concurrent.log

prompt Concurrent Stats - Deinstallation
prompt *----------------------------------------------------*
prompt This script will now attempt to drop the objects
prompt belonging to this installation
accept skip_deinstall prompt 'Hit Enter to continue, CTRL+C to cancel or enter S to skip deinstall: '

set serveroutput on

declare
  procedure exec_ignore_fail(p_sql in varchar2)
  as
  begin
    execute immediate p_sql;
  exception
  when others then
    dbms_output.put_line('Error executing: ' || p_sql);
    dbms_output.put_line('Error message: ' || SQLERRM);
  end;
begin
  if upper('&skip_deinstall') = 'S' then
    null;
  else
    exec_ignore_fail('begin pk_stats_concurrent.teardown_aq; end;');
    exec_ignore_fail('drop table stats_concurrent_log');
    exec_ignore_fail('drop type stats_concurrent_info force');
    exec_ignore_fail('drop package pk_stats_concurrent');
    exec_ignore_fail('begin dbms_scheduler.drop_job_class(''CONC_STATS''); end;');
  end if;
end;
/

prompt Concurrent Stats - Installation
prompt *----------------------------------------------------*
prompt This script will now attempt to create the objects
prompt belonging to this installation
PAUSE  Hit CTRL+C to cancel, ENTER to continue...

/**
  * The log table for minimum logging of the concurrent execution threads
  * Since we cannot access the DBMS_OUTPUT of these separate processes
  * This needs to be cleaned up manually if / when required
  **/
create table stats_concurrent_log (log_timestamp timestamp, sql_statement clob, message clob);

/**
  * The single object type used as payload in the AQ queue for concurrent execution
  * Each message will have a description of the index plus the actual DDL text as payload
  **/
create or replace type stats_concurrent_info as object
(
  ownname                        varchar2(30)
, tabname                        varchar2(30)
, partname                       varchar2(30)
, degree                         number
, granularity                    varchar2(30)
);
/

show errors

create or replace package pk_stats_concurrent authid current_user
as

  ------------------------------------------------------------------------------
  -- $Id$
  ------------------------------------------------------------------------------

  /**
   * PK_STATS_CONCURRENT.SQL
   *
   * Created By    : Randolf Geist (http://oracle-randolf.blogspot.com)
   * Creation Date : 31-OCT-2016
   * Last Update   : 06-DEC-2016
   * Authors       : Randolf Geist (RG)
   *
   * History       :
   *
   * When        | Who | What
   * ----------------------------------
   * 31-OCT-2016 | RG  | Created
   * 06-DEC-2016 | RG  | This header comment updated
   *
   * Description   :
   *
   * This is a simple prototype implementation for the given task of gathering database stats
   * concurrently, in case you are not satisfied with the built-in concurrent stats option available since 11.2.0.x
   *
   * In 11.2, the CONCURRENT stats option creates as many jobs as there are objects to gather
   * And the JOB_QUEUE_PROCESSES parameter then controls the number of concurrent jobs running
   * Since the ordering of execution isn't really optimized, many of these concurrent jobs might attempt to gather stats on the same object in case it is (sub)partitioned
   * This can lead to significant contention on Library Cache level (due to exclusive Library Cache Locks required by DDL / DBMS_STATS)
   *
   * In 12.1 the CONCURRENT stats option was obviously completed rewritten and uses some more intelligent processing
   * by calculating if and yes how many jobs should run concurrently for what kind of objects (see for example the new DBA_OPTSTAT_OPERATION_TASKS view that exposes some of these details)
   * Still I've observed many occasions with this new implementation where lots of objects were deliberately gathered in the main session
   * one after the other which doesn't really make good use of available resources in case many objects need to be analyzed
   *
   * This implementation tries to work around these points by using a simple queue-based approach for true concurrent stats processing
   * combined with an attempt to distribute the tables to analyze across the different threads in a way that minimizes the contention on Library Cache level
   *
   * It needs to be installed / executed under a suitable account that has the privileges to create queues, types, packages, tables, jobs and job classes and gather stats on the whole database
   *
   * A sample user profile could look like this:

   create user conc_stats identified by conc_stats;

   grant create session, create table, create procedure, create type, create job, manage scheduler, analyze any, analyze any dictionary to conc_stats;

   grant execute on sys.dbms_aq to conc_stats;

   grant execute on sys.dbms_aqadm to conc_stats;

   grant select on sys.v_$parameter to conc_stats;

   alter user conc_stats default tablespace users;

   alter user conc_stats quota unlimited on users;

   * Parameters to be checked, depending on concurrency desired:
   *
   * job_queue_processes: Needs to be set high enough to accommodate for the concurrent stats threads spawned. By default this package spawns CPU_COUNT concurrent threads
   * parallel_max_servers: If a stats thread is supposed to use Parallel Execution (degree > 1) for gathering stats you'll need at least threads * degree Parallel Slaves configured
   * services: It's possible to specify a service to have the stats threads only executed on RAC nodes that run that service
   *
   * The jobs are created under the same job class, currently hard coded value CONC_STATS - this makes the handling easier in case you want to stop / drop the jobs submitted manually
   *
   * The job class name can be passed to calls to DBMS_SCHEDULER.DROP_JOB or STOP_JOB - remember that job classes are owned by SYS, so you have to specify SYS.CONC_STATS for the job class name used here
   *
   * The main entry point STATS_CONCURRENT is all you need to call to start concurrent stats gathering on the database
   * similar to GATHER_DATABASE_STATS using one of the options GATHER, GATHER STALE or GATHER AUTO (default) - here you have to use LIST EMPTY, LIST STALE or LIST AUTO (default)
   *
   * The default behaviour when not specifying any parameters is to start as many threads as there are CPUs by using the CPU_COUNT parameter
   * If you want this to be multiplied by the number of instances in a RAC cluster uncomment the CLUSTER_DATABASE_INSTANCES reference below in the code (assuming same CPU_COUNT on all nodes)
   *
   * This also means that the "intra" parallelism per gather_table_stats call will be one in such a case since the intra parallelism is calculated by default as CPU_COUNT / number of threads
   *
   * If you don't want to have that many threads / PX slaves started, specify the number of concurrent threads and an intra-operation DOP explicitly when calling STATS_CONCURRENT
   *
   * If you want to replace the default nightly stats job with this here, the following steps should achieve this:

   BEGIN DBMS_AUTO_TASK_ADMIN.disable(
     client_name => 'auto optimizer stats collection',
     operation   => NULL,
     window_name => NULL);
   END;

   BEGIN DBMS_SCHEDULER.CREATE_JOB(
     job_name => '',
     schedule_name => 'MAINTENANCE_WINDOW_GROUP',
     job_type => 'PLSQL_BLOCK',
     job_action => 'begin pk_stats_concurrent.stats_concurrent(); end;',
     comments => 'auto optimizer stats collection replacement using concurrent stats operations based on AQ'
     enabled => true);
   END;

   * Please ensure the job is submitted under the account it's supposed to be run - using a different account like SYS to submit the job for a different schema
   * seems to cause problems with privileges (insufficient privileges error messages), at least this was reported to me
   *
   * The code at present only processes objects of type TABLE returned by GATHER_DATABASE_STATS but not indexes
   * assuming that these should be covered by the CASCADE functionality
   *
   * Note: This script is a prototype and comes with NO warranty. Use at your own risk and test/adjust in your environment as necessary
   *       before using it in any production-like case
   *
   * @headcom
   **/

  subtype oracle_object      is varchar2(30);

  /**
   * Let the procedure stats_concurrent decide itself which degree to use.
   * At present this means simply to spawn as many child threads as defined by the CPU_COUNT parameter
   **/
  G_AUTO_PARALLEL_DEGREE            constant integer       := null;

  /**
   * The main entry point to gather statistics via parallel threads / AQ
   * @param p_parallel_degree The number of threads to start G_AUTO_PARALLEL_DEGREE means use the CPU_COUNT parameter to determine number of threads automatically
   * @param p_intra_degree The DOP to use per stats operation, by default calculate DOP based on CPU_COUNT and number of threads to run concurrently (Default DOP = CPU_COUNT / number of threads)
   * @param p_service Specify a service if you want the jobs to be assigned to that particular service, default NULL
   * @param p_gather_option What to pass to GATHER_DATABASE_STATS as option, default LIST AUTO
   * @param p_optional_init Optionally a SQL can be passed usually used to initialize the session
            for example forcing a particular parallel degree
   **/
  procedure stats_concurrent(
    p_parallel_degree in integer  default G_AUTO_PARALLEL_DEGREE
  , p_intra_degree    in integer  default null
  , p_service         in varchar2 default null
  , p_gather_option   in varchar2 default 'LIST AUTO'
  , p_optional_init   in varchar2 default null
  );

  /**
   * Setup the AQ infrastructure (Queue tables, Queues)
   **/
  procedure setup_aq;

  /**
   * Teardown the AQ infrastructure (Queue tables, Queues)
   **/
  procedure teardown_aq;

  /**
   * Helper function to populate the AQ queue with data to process
   * @param p_gather_option What to pass to GATHER_DATABASE_STATS as option, default LIST AUTO
   **/
  function list_stale_database_stats (
    p_gather_option    in  varchar2 default 'LIST AUTO'
  )
  return dbms_stats.objecttab pipelined;

  /**
   * Populate the AQ queue with data to process
   * @param p_parallel_degree The number threads to use - will be used for proper data preparation / queueing order
   * @param p_intra_degree The DOP to use per stats operation, by default calculate DOP based on CPU_COUNT and number of threads to run concurrently
   * @param p_gather_option What to pass to GATHER_DATABASE_STATS as option, default LIST AUTO
   **/
  procedure populate_queue(
    p_parallel_degree in integer
  , p_intra_degree    in integer default null
  , p_gather_option   in varchar2 default 'LIST AUTO'
  );

  /**
   * This gets called for every stats thread
   * It pulls the object to gather from the AQ queue
   * @param p_optional_init Optionally a SQL can be passed usually used to initialize the session
            for example forcing a particular parallel degree
   **/
  procedure stats_thread(
    p_optional_init         in varchar2 default null
  );

end pk_stats_concurrent;
/

show errors

create or replace package body pk_stats_concurrent
as
  ------------------------------------------------------------------------------
  -- $Id$
  ------------------------------------------------------------------------------

  /**
   * PK_STATS_CONCURRENT.SQL
   *
   * Created By    : Randolf Geist (http://oracle-randolf.blogspot.com)
   * Creation Date : 31-OCT-2016
   * Last Update   : 06-DEC-2016
   * Authors       : Randolf Geist (RG)
   *
   * History       :
   *
   * When        | Who | What
   * ----------------------------------
   * 31-OCT-2016 | RG  | Created
   * 06-DEC-2016 | RG  | This header comment updated
   *
   * Description   :
   *
   * This is a simple prototype implementation for the given task of gathering database stats
   * concurrently, in case you are not satisfied with the built-in concurrent stats option available since 11.2.0.x
   *
   * In 11.2, the CONCURRENT stats option creates as many jobs as there are objects to gather
   * And the JOB_QUEUE_PROCESSES parameter then controls the number of concurrent jobs running
   * Since the ordering of execution isn't really optimized, many of these concurrent jobs might attempt to gather stats on the same object in case it is (sub)partitioned
   * This can lead to significant contention on Library Cache level (due to exclusive Library Cache Locks required by DDL / DBMS_STATS)
   *
   * In 12.1 the CONCURRENT stats option was obviously completed rewritten and uses some more intelligent processing
   * by calculating if and yes how many jobs should run concurrently for what kind of objects (see for example the new DBA_OPTSTAT_OPERATION_TASKS view that exposes some of these details)
   * Still I've observed many occasions with this new implementation where lots of objects were deliberately gathered in the main session
   * one after the other which doesn't really make good use of available resources in case many objects need to be analyzed
   *
   * This implementation tries to work around these points by using a simple queue-based approach for true concurrent stats processing
   * combined with an attempt to distribute the tables to analyze across the different threads in a way that minimizes the contention on Library Cache level
   *
   * It needs to be installed / executed under a suitable account that has the privileges to create queues, types, packages, tables, jobs and job classes and gather stats on the whole database
   *
   * A sample user profile could look like this:

   create user conc_stats identified by conc_stats;

   grant create session, create table, create procedure, create type, create job, manage scheduler, analyze any, analyze any dictionary to conc_stats;

   grant execute on sys.dbms_aq to conc_stats;

   grant execute on sys.dbms_aqadm to conc_stats;

   grant select on sys.v_$parameter to conc_stats;

   alter user conc_stats default tablespace users;

   alter user conc_stats quota unlimited on users;

   * Parameters to be checked, depending on concurrency desired:
   *
   * job_queue_processes: Needs to be set high enough to accommodate for the concurrent stats threads spawned. By default this package spawns CPU_COUNT concurrent threads
   * parallel_max_servers: If a stats thread is supposed to use Parallel Execution (degree > 1) for gathering stats you'll need at least threads * degree Parallel Slaves configured
   * services: It's possible to specify a service to have the stats threads only executed on RAC nodes that run that service
   *
   * The jobs are created under the same job class, currently hard coded value CONC_STATS - this makes the handling easier in case you want to stop / drop the jobs submitted manually
   *
   * The job class name can be passed to calls to DBMS_SCHEDULER.DROP_JOB or STOP_JOB - remember that job classes are owned by SYS, so you have to specify SYS.CONC_STATS for the job class name used here
   *
   * The main entry point STATS_CONCURRENT is all you need to call to start concurrent stats gathering on the database
   * similar to GATHER_DATABASE_STATS using one of the options GATHER, GATHER STALE or GATHER AUTO (default) - here you have to use LIST EMPTY, LIST STALE or LIST AUTO (default)
   *
   * The default behaviour when not specifying any parameters is to start as many threads as there are CPUs by using the CPU_COUNT parameter
   * If you want this to be multiplied by the number of instances in a RAC cluster uncomment the CLUSTER_DATABASE_INSTANCES reference below in the code (assuming same CPU_COUNT on all nodes)
   *
   * This also means that the "intra" parallelism per gather_table_stats call will be one in such a case since the intra parallelism is calculated by default as CPU_COUNT / number of threads
   *
   * If you don't want to have that many threads / PX slaves started, specify the number of concurrent threads and an intra-operation DOP explicitly when calling STATS_CONCURRENT
   *
   * If you want to replace the default nightly stats job with this here, the following steps should achieve this:

   BEGIN DBMS_AUTO_TASK_ADMIN.disable(
     client_name => 'auto optimizer stats collection',
     operation   => NULL,
     window_name => NULL);
   END;

   BEGIN DBMS_SCHEDULER.CREATE_JOB(
     job_name => '',
     schedule_name => 'MAINTENANCE_WINDOW_GROUP',
     job_type => 'PLSQL_BLOCK',
     job_action => 'begin pk_stats_concurrent.stats_concurrent(); end;',
     comments => 'auto optimizer stats collection replacement using concurrent stats operations based on AQ'
     enabled => true);
   END;

   * Please ensure the job is submitted under the account it's supposed to be run - using a different account like SYS to submit the job for a different schema
   * seems to cause problems with privileges (insufficient privileges error messages), at least this was reported to me
   *
   * The code at present only processes objects of type TABLE returned by GATHER_DATABASE_STATS but not indexes
   * assuming that these should be covered by the CASCADE functionality
   *
   * Note: This script is a prototype and comes with NO warranty. Use at your own risk and test/adjust in your environment as necessary
   *       before using it in any production-like case
   *
   * @headcom
   **/

  -- The queue name to use for AQ operations
  G_QUEUE_NAME               constant varchar2(24) := 'STATS_QUEUE';

  /**
   * Rudimentary logging required by the parallel threads since the
   * serveroutput generated can not be accessed
   * @param p_sql The SQL to log that raised the error
   * @param p_error_msg The error message to log
   **/
  procedure log(
    p_sql in clob
  , p_msg in clob
  )
  as
    -- We do this in an autonomous transaction since we want the logging
    -- to be visible while any other main transactions might be still going on
    pragma autonomous_transaction;
  begin
    insert into stats_concurrent_log(
      log_timestamp
    , sql_statement
    , message
    ) values (
      systimestamp
    , p_sql
    , p_msg
    );
    commit;
  end log;

  /**
   * Execute a SQL statement potentially in a different schema (dummy implementation here).
   * The string will be put to serveroutput before being executed
   * @param p_owner The schema to execute
   * @param p_sql The SQL to execute
   * @param p_log_error Should an error be logged or not. Default is true
   **/
  procedure execute(
    p_owner     in oracle_object
  , p_sql       in clob
  , p_log_error in boolean default true
  )
  as
  begin
    -- dbms_output.put_line('Owner: ' || p_owner || ' SQL: ' || substr(p_sql, 1, 4000));
  $if dbms_db_version.ver_le_10 $then
    declare
      a_sql           dbms_sql.varchar2a;
      n_start_line    number;
      n_end_line      number;
      c               integer;
      n               integer;
      LF constant     varchar2(10) := '
';
      len_LF constant integer := length(LF);
    begin
      n_start_line := 1 - len_LF;
      loop
        n_end_line := instr(p_sql, LF, n_start_line + len_LF);
        a_sql(a_sql.count + 1) := substr(p_sql, n_start_line + len_LF, case when n_end_line = 0 then length(p_sql) else n_end_line end - (n_start_line + len_LF) + len_LF);
        -- dbms_output.put_line(a_sql.count || ':' || a_sql(a_sql.count));
        exit when n_end_line = 0;
        n_start_line := n_end_line;
      end loop;
      c := dbms_sql.open_cursor;
      dbms_sql.parse(c, a_sql, 1, a_sql.count, false, dbms_sql.NATIVE);
      n := dbms_sql.execute(c);
      dbms_sql.close_cursor(c);
    end;
  $elsif dbms_db_version.ver_le_11 $then
    execute immediate p_sql;
  $else
    execute immediate p_sql;
  $end
  exception
  when others then
    dbms_output.put_line('Error: ' || SQLERRM);
    if p_log_error then
      log(p_sql, SQLERRM);
    end if;
    raise;
  end execute;

  /**
   * Execute a SQL statement potentially in a different schema (dummy implementation here).
   * This one uses an autonomous transaction.
   * The string will be put to serveroutput before being executed
   * @param p_owner The schema to execute
   * @param p_sql The SQL to execute
   * @param p_log_error Should an error be logged or not. Default is true
   **/
  procedure execute_autonomous(
    p_owner     in oracle_object
  , p_sql       in clob
  , p_log_error in boolean default true
  )
  as
    pragma autonomous_transaction;
  begin
    execute(p_owner, p_sql, p_log_error);
  end execute_autonomous;

  /**
   * Setup the AQ infrastructure (Queue tables, Queues)
   **/
  procedure setup_aq
  as
  begin
    begin
      execute(
        null
      , 'begin dbms_aqadm.create_queue_table(
           queue_table => ''' || G_QUEUE_NAME || '''
         , queue_payload_type => ''stats_concurrent_info''
         ); end;'
      );
    exception
    when others then
      dbms_output.put_line('Error creating Queue table: ' || SQLERRM);
      raise;
    end;

    begin
      execute(
        null
      , 'begin dbms_aqadm.create_queue(
           queue_name => ''' || G_QUEUE_NAME || '''
         , queue_table => ''' || G_QUEUE_NAME || '''
         ); end;'
      );
    exception
    when others then
      dbms_output.put_line('Error creating Queue: ' || SQLERRM);
      raise;
    end;

    begin
      execute(
        null
      , 'begin dbms_aqadm.start_queue(
           queue_name => ''' || G_QUEUE_NAME || '''
         ); end;'
      );
    exception
    when others then
      dbms_output.put_line('Error starting Queue: ' || SQLERRM);
      raise;
    end;
  end setup_aq;

  /**
   * Teardown the AQ infrastructure (Queue tables, Queues)
   **/
  procedure teardown_aq
  as
  begin
    begin
      execute(
        null
      , 'begin dbms_aqadm.stop_queue(
           queue_name => ''' || G_QUEUE_NAME || '''
         , wait       => true
         ); end;'
      , false
      );
    exception
    when others then
      dbms_output.put_line('Error stopping Queue: ' || SQLERRM);
      -- raise;
    end;

    begin
      execute(
        null
      , 'begin dbms_aqadm.drop_queue(
           queue_name => ''' || G_QUEUE_NAME || '''
         ); end;'
      , false
      );
    exception
    when others then
      dbms_output.put_line('Error dropping Queue: ' || SQLERRM);
      -- raise;
    end;

    begin
      execute(
        null
      , 'begin dbms_aqadm.drop_queue_table(
           queue_table => ''' || G_QUEUE_NAME || '''
         , force => true
         ); end;'
      , false
      );
    exception
    when others then
      dbms_output.put_line('Error dropping Queue table: ' || SQLERRM);
      -- raise;
    end;

  end teardown_aq;

  /**
   * Helper function to populate the AQ queue with data to process
   * @param p_gather_option What to pass to GATHER_DATABASE_STATS as option, default LIST AUTO
   **/
  function list_stale_database_stats (
    p_gather_option    in  varchar2 default 'LIST AUTO'
  )
  return dbms_stats.objecttab pipelined
  as
    pragma autonomous_transaction;
    m_object_list   dbms_stats.objecttab;
  begin
    if p_gather_option not in (
        'LIST AUTO', 'LIST STALE','LIST EMPTY'
    ) then
        null;
      else
        dbms_stats.gather_database_stats(
            options     => p_gather_option,
            objlist     => m_object_list
        );
        for i in 1..m_object_list.count loop
          pipe row (m_object_list(i));
        end loop;
    end if;
    return;
  end list_stale_database_stats;

  /**
   * Populate the AQ queue with data to process
   * @param p_parallel_degree The number threads to use - will be used for proper data preparation / queueing order
   * @param p_intra_degree The DOP to use per stats operation, by default calculate DOP based on CPU_COUNT and number of threads to run concurrently
   * @param p_gather_option What to pass to GATHER_DATABASE_STATS as option, default LIST AUTO
   **/
  procedure populate_queue(
    p_parallel_degree in integer
  , p_intra_degree    in integer default null
  , p_gather_option   in varchar2 default 'LIST AUTO'
  )
  as
    enq_msgid     raw(16);
    payload       stats_concurrent_info := stats_concurrent_info(null, null, null, null, null);
    n_dop         integer;
  begin
    -- By default determine what intra-operation DOP to use depending on how many concurrent stats threads are supposed to run
    select nvl(p_intra_degree, ceil((select to_number(value) from v$parameter where name = 'cpu_count') / p_parallel_degree)) as dop
    into n_dop
    from dual;
    -- Populate the queue and use some "intelligent" ordering attempting to minimize (library cache) contention on the objects
    for rec in (
      with
      -- The baseline, all TABLE objects returned by GATHER_DATABASE_STATS LIST* call
      a as (
      select /*+ materialize */ rownum as rn, a.* from table(pk_stats_concurrent.list_stale_database_stats(p_gather_option)) a where objtype = 'TABLE'
      ),
      -- Assign all table, partitions and subpartitions to p_parallel_degree buckets
      concurrent_stats as (
      select ntile(p_parallel_degree) over (order by rn) as new_order, a.* from a where partname is null
      union all
      select ntile(p_parallel_degree) over (order by rn) as new_order, a.* from a where partname is not null and subpartname is null
      union all
      select ntile(p_parallel_degree) over (order by rn) as new_order, a.* from a where partname is not null and subpartname is not null
      ),
      -- Now assign a row number within each bucket
      b as (
      select c.*, row_number() over (partition by new_order order by rn) as new_rn from concurrent_stats c
      )
      -- And pick one from each bucket in turn for queuing order
      select
              ownname
            , objname as tabname
            , coalesce(subpartname, partname) as partname
            , n_dop as degree
            , case when partname is null then 'GLOBAL' when partname is not null and subpartname is null then 'PARTITION' else 'SUBPARTITION' end as granularity
      from
              b
      order by
              new_rn, new_order
    ) loop
      payload.ownname     := rec.ownname;
      payload.tabname     := rec.tabname;
      payload.partname    := rec.partname;
      payload.degree      := rec.degree;
      payload.granularity := rec.granularity;
      -- TODO: Enqueue via array using ENQUEUE_ARRAY
      execute immediate '
      declare
        eopt          dbms_aq.enqueue_options_t;
        mprop         dbms_aq.message_properties_t;
      begin
        dbms_aq.enqueue(
            queue_name => ''' || G_QUEUE_NAME || ''',
            enqueue_options => eopt,
            message_properties => mprop,
            payload => :payload,
            msgid => :enq_msgid);
      end;'
      using payload, out enq_msgid;
    end loop;
    commit;
  end populate_queue;

  /**
   * This gets called for every stats thread
   * It pulls the object to gather from the AQ queue
   * @param p_optional_init Optionally a SQL can be passed usually used to initialize the session
            for example forcing a particular parallel degree
   **/
  procedure stats_thread(
    p_optional_init         in varchar2 default null
  )
  as
    deq_msgid             RAW(16);
    payload               stats_concurrent_info;
    no_messages           exception;
    pragma exception_init(no_messages, -25228);
    s_sql                 clob;
  begin
    if p_optional_init is not null then
      execute(null, p_optional_init);
    end if;

    -- If the VISIBILITY is set to IMMEDIATE
    -- it will cause the "queue transaction" to be committed
    -- Which means that the STOP_QUEUE call with the WAIT option will
    -- be able to stop the queue while the processing takes place
    -- and the queue table can be monitored for progress
    loop
      begin
        execute immediate '
        declare
          dopt                  dbms_aq.dequeue_options_t;
          mprop                 dbms_aq.message_properties_t;
        begin
          dopt.visibility := dbms_aq.IMMEDIATE;
          dopt.wait := dbms_aq.NO_WAIT;
          dbms_aq.dequeue(
              queue_name => ''' || G_QUEUE_NAME || ''',
              dequeue_options => dopt,
              message_properties => mprop,
              payload => :payload,
              msgid => :deq_msgid);
        end;'
        using out payload, out deq_msgid;
        s_sql := '
begin
  dbms_stats.gather_table_stats(
    ownname     => ''' || payload.ownname     || '''
  , tabname     => ''' || payload.tabname     || '''
  , partname    => ''' || payload.partname    || '''
  , degree      => ' || payload.degree      || '
  , granularity => ''' || payload.granularity || '''
  );
end;
';
        -- Execute the command
        log(s_sql, 'Ownname: ' || payload.ownname || ' Tabname: ' || payload.tabname || ' Partname: ' || payload.partname || ' Degree: ' || payload.degree || ' Granularity: ' || payload.granularity);
        begin
          execute_autonomous(payload.ownname, s_sql);
        exception
        /*
        when object_already_exists then
          null;
        when object_does_not_exist then
          null;
        */
        when others then
          null;
        end;
      exception
      when no_messages then
        exit;
      end;
    end loop;
    commit;
  end stats_thread;

  /**
   * The main entry point to gather statistics via parallel threads / AQ
   * @param p_parallel_degree The number of threads to start G_AUTO_PARALLEL_DEGREE means use the CPU_COUNT (but not
            CLUSTER_DATABASE_INSTANCES parameter, commented out below) to determine number of threads automatically
   * @param p_intra_degree The DOP to use per stats operation, by default calculate DOP based on CPU_COUNT and number of threads to run concurrently
   * @param p_service Specify a service if you want the jobs to be assigned to that particular service, default NULL
   * @param p_gather_option What to pass to GATHER_DATABASE_STATS as option, default LIST AUTO
   * @param p_optional_init Optionally a SQL can be passed usually used to initialize the session
            for example forcing a particular parallel degree
   **/
  procedure stats_concurrent(
    p_parallel_degree in integer  default G_AUTO_PARALLEL_DEGREE
  , p_intra_degree    in integer  default null
  , p_service         in varchar2 default null
  , p_gather_option   in varchar2 default 'LIST AUTO'
  , p_optional_init   in varchar2 default null
  )
  as
    n_cpu_count          binary_integer;
    n_instance_count     binary_integer;
    n_thread_count       binary_integer;
    strval               varchar2(256);
    partyp               binary_integer;
    e_job_class_exists exception;
    pragma exception_init(e_job_class_exists, -27477);
    s_job_class constant varchar2(30) := 'CONC_STATS';
  begin
    -- Truncate the log table
    execute immediate 'truncate table stats_concurrent_log';
    -- Just in case something has been left over from a previous run
    teardown_aq;
    setup_aq;
    -- Populate the queue
    populate_queue(p_parallel_degree, p_intra_degree, p_gather_option);
    -- Determine auto degree of parallelism
    partyp := dbms_utility.get_parameter_value('cpu_count', n_cpu_count, strval);
    partyp := dbms_utility.get_parameter_value('cluster_database_instances', n_instance_count, strval);
    n_thread_count := nvl(p_parallel_degree, n_cpu_count/* * n_instance_count*/);
    -- Create/use a common job class, makes job handling easier and allows binding to a specific service
    begin
      dbms_scheduler.create_job_class(s_job_class);
    exception
    when e_job_class_exists then
      null;
    end;
    -- Assign jobs to a particular service if requested
    if p_service is null then
      dbms_scheduler.set_attribute_null('SYS.' || s_job_class, 'SERVICE');
    else
      dbms_scheduler.set_attribute('SYS.' || s_job_class, 'SERVICE', p_service);
    end if;
    -- Submit the jobs
    for i in 1..n_thread_count loop
      dbms_scheduler.create_job(
        job_name   => s_job_class || '_' || i
      , job_type   => 'PLSQL_BLOCK'
      , job_class  => s_job_class
      , enabled    => true
      , job_action => 'begin dbms_session.set_role(''ALL''); pk_stats_concurrent.stats_thread(''' || p_optional_init || '''); end;'
      );
    end loop;
    -- Just in case anyone wants to use DBMS_JOB instead we need to commit the DBMS_JOB.SUBMIT
    commit;
    --execute immediate 'begin dbms_lock.sleep(:p_sleep_seconds); end;' using p_sleep_seconds;
    --teardown_aq;
  end stats_concurrent;
end pk_stats_concurrent;
/

show errors

spool off
Saturday, November 19, 2016
DOAG 2016 - "Oracle Database Cloud Performance" presentation material
Thanks to all attendees that came to my presentation "Oracle Database Cloud Performance" at the DOAG conference 2016. You can check the presentation material here at Slideshare.
Monday, November 7, 2016
Oracle Database Cloud (DBaaS) Performance Consistency - Part 7
This part of the series is supposed to cover the results of I/O related tests performed on the Amazon RDS Oracle cloud instance.
As mentioned in the previous part of this series I've only used the "General Purpose SSD" storage type since the "Provisioned IOPS" storage was simply to expensive to me and it wasn't possible to get a trial license for that storage type.
Now one key aspect of the "General Purpose SSD" storage offered by Amazon RDS is that it is limited to a peak IOPS performance of 3.000 IOPS, and this peak performance will be delivered only for a limited amount of time if you happen to have storage allocated less than 1.000GB - more details can be found on the Amazon RDS documentation.
So in my case since I did a comparison to the Oracle Cloud setup with just 100GB of storage allocated this configuration was only capable of sustaining the peak performance of 3.000 IOPS for a maximum of 2.000 seconds, which is a little more than 30 minutes.
After that the IOPS rate gets limited to the base rate, which in my case here was just 300 IOPS.
Effectively this meant with that configuration I could simply not perform the same I/O heavy tests reasonably - each loop iteration would have taken hours, and then again I didn't plan to run the tests for a very long time since it would simply become too expensive.
To give an idea how running the same test setup would have performed on this Amazon RDS "General Purpose SSD" storage, here is the individual thread performance for the "read-only" I/O test (for details see this blog post, at the end of that post you can also find the median runtimes for the Oracle Cloud DBaaS offering):

So after using up the "I/O credits" for the peak IOPS performance, which is still 10 times slower than the IOPS rate of the Oracle Clould DBaaS offering (approximately 640 seconds per iteration vs. 64 seconds, 3.000 vs. 30.000 IOPS), the rate drops to 300+ IOPS, meaning loop iteration runtimes of 4.500+ seconds - this more than one hour! to run a single iteration of the test that takes slightly more than a minute on the Oracle Cloud DBaaS offering.
I stopped the I/O tests there since I didn't see a point in continuing this further - the two offerings simply can't be compared on that basis. It would have been different when using the "Provisioned IOPS" storage configuration, but that was simply too expensive for such a small test.
Wednesday, November 2, 2016
"Cost Based Optimizer: Grundlagen – mit Update für Oracle 12c" Artikel (German)
Seit gestern steht auf der "Informatik Aktuell"-Seite mein Artikel "Cost Based Optimizer: Grundlagen – mit Update für Oracle 12c" zur Verfügung.
Er stimmt auch inhaltlich auf meinen Vortrag bei den IT-Tagen 2016 am 13. Dezember ein.
Sollte Sie das Thema interessieren, lade ich Sie hiermit also herzlich zu meinem Vortrag ein, bei dem ich das Thema auch mit Live-Demonstrationen vertiefen werde.
Sunday, October 23, 2016
Oracle Database Cloud (DBaaS) Performance Consistency - Part 6
In the next parts of this series I'll have a look at the results of similar performance consistency tests performed on a comparable Amazon RDS Oracle cloud database instance.


Let's start with the configuration used, which was an Amazon RDS "db.m4.2xlarge" instance - the latest RDS generation available at time of testing. This is an 8 VCPUs resp. Hyper Threads / 4 cores configuration with 32GB of RAM.
As storage I've used the "General Purpose SSD" setup. Although there is a "Provisioned IOPS" configuration available, too, I haven't used for testing because according to the price calculator available it would have costed me several hundred dollar even for a very short period of testing because some part of the configuration gets charged per month, no matter how long I actually use it. I'll get back to that point when dealing with the I/O related tests and the raw performance figures.
Therefore I've only run the tests on the "General Purpose SSD" configuration - more on that in later installments.
Even without the "Provisioned IOPS" storage the tests were only conducted for several hours instead of several days, therefore they can't be compared directly to the other test results.
The first test conducted was the "PL/SQL" CPU burning test I've outlined in the first part of this series.
The overall consistency result looked like this:
Again the graph is supposed to show how many of the runs deviated how much from the overall median runtime. The results - at least for the short period of the test run - are very consistent, similar to the other test results.
Looking at the results on a more granular basis is only of limited use in this case due to the short test run time, hence the resolution is changed to hours instead of days here:
There were a couple of hours that show a very similar behaviour and again another set of hours with rather a similar profile, and there is an hour with a rather unusual profile.
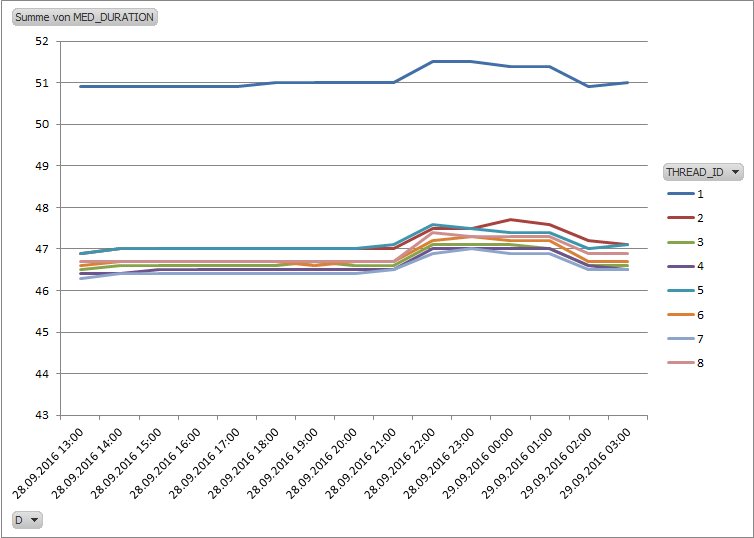
Finally, looking at the runtime of the individual threads:
Except for one threads all other show a very similar runtime, also the runtime is very consistent.
It should be noted however, that the actual raw performance of each thread is pretty different from that of the Oracle DBaaS offering based on 4 OCPUs, because the DBaaS offering actually provides 8 cores, and hence scales much better when running with 8 threads - see the corresponding previous test results. The Amazon RDS raw performance is more comparable to that of the 4 cores physical host used in the previous tests for comparison.
Monday, October 17, 2016
Oracle Database Cloud (DBaaS) Performance Consistency - Part 5
This is the fifth part of this installment, and before coming to comparisons to other cloud providers, in this part I show the results of the read-only test that I've already described in part three of this series, but repeated at a later point in time. The test setup was identical and can be checked in the mentioned previous part.
The reason for running the test again was the fact that I was informed during the first test run that the zone that my Oracle Cloud domain was assigned to was temporarily overloaded, which I also noticed since I wasn't able to create new services for some time.
Hence I decided to repeat the tests after it was confirmed that the issue got resolved.
So here is a comparison of the second test run results compared to the first test run - the corresponding results for the dedicated physical host can be found in part three.
Overall consistency second run:

Overall consistency first run:

Again the graph is supposed to show how many of the runs deviated how much from the overall median runtime. The second run shows a much improved overall consistency much closer to that of the dedicated physical host, although a few outliers are more extreme than in the first run,
The same data on per day basis, second run:

First run:

Except for the first two days the second run shows a pretty consistent behaviour per day, and it becomes obvious that it's the second day of the second run that is responsible for the extreme outliers and also the significant inconsistency in the area between 8 and 12 percent deviation.
Finally the individual thread performance, second run:

First run:

The individual thread performance graph confirms the much improved consistency compared to the first run.
The reason for running the test again was the fact that I was informed during the first test run that the zone that my Oracle Cloud domain was assigned to was temporarily overloaded, which I also noticed since I wasn't able to create new services for some time.
Hence I decided to repeat the tests after it was confirmed that the issue got resolved.
So here is a comparison of the second test run results compared to the first test run - the corresponding results for the dedicated physical host can be found in part three.
Overall consistency second run:
Overall consistency first run:
Again the graph is supposed to show how many of the runs deviated how much from the overall median runtime. The second run shows a much improved overall consistency much closer to that of the dedicated physical host, although a few outliers are more extreme than in the first run,
The same data on per day basis, second run:
First run:
Except for the first two days the second run shows a pretty consistent behaviour per day, and it becomes obvious that it's the second day of the second run that is responsible for the extreme outliers and also the significant inconsistency in the area between 8 and 12 percent deviation.
Finally the individual thread performance, second run:
First run:
The individual thread performance graph confirms the much improved consistency compared to the first run.
Sunday, October 9, 2016
Upcoming Public Appearances
It's that time of the year again... I'll be speaking at the following events:
- SSWUG 2016 Fall Virtual Conference: On November 15th I'll do the geeky stuff that was rejected by DOAG this year, which is "Oracle Database Parallel Execution plans deep dive - understanding the internals of Parallel Execution plans". You should only attend this session if you already have a good understanding of serial execution plans.
- DOAG Conference 2016: On November the 16th I'll present "Oracle Database Cloud Performance" where I talk about my experience regarding the performance of the Oracle DBaaS offerings. Note that some printed conference schedule material is outdated, I'll speak at 3pm, not 10am
- IT Tage 2016: On December 13th I'll present "Oracle 12c - Cost Based Optimizer Grundlagen" which describes the basics of the Cost Based Optimizer with an update how things might be different with Oracle 12c
Hope to see you at some of these events - if you're going to be there, say Hello!
Monday, October 3, 2016
Oracle Database Cloud (DBaaS) Performance Consistency - Part 4
This is the fourth part of this installment, comparing the performance consistency of the DBaaS cloud offering with a dedicated physical host. This time the previous read-only test was modified to be a 100% update read-write test. So every row read was updated in the following way:
begin
loop
for rec in (
select /*+
index(t_o)
*/
id_fk
from
t_o
) loop
update t_i&tabname t_i
set n = rec.id_fk
where id = rec.id_fk;
end loop;
insert into timings(testtype, thread_id, ts) values ('&testtype', &thread_id, systimestamp);
commit;
end loop;
end;
/

Physical Host:


Again the graph is supposed to show how many of the runs deviated how much from the overall median runtime. Again the DBaaS service shows a significantly different profile, but this time performed more consistently than in the previous read-only test - the probable reason for the difference will be explained in a later part of this series. The DBaaS service this time had some extreme outliers (max. > 160 percent deviation) that I didn't include in the graph to not distort the graph too much - but it were just a few runs out of more than 25.000 that were affected.
The same data on per day (per hour for the physical host) basis:
DBaaS:

Physical host:

As mentioned above the physical host data covers only a few hours and hence can't really be compared to the DBaaS data covering more than a week of data.
Finally the individual thread performance:
DBaaS:

Physical host:

Both environments show pretty stable run times per thread over time, and the graphs confirm what is mentioned above: The physical host this time outperforms the DBaaS, however, as already mentioned, a slightly unfair comparison as the physical host didn't had to read and write encrypted blocks.
The next parts will cover comparisons to other cloud providers.
begin
loop
for rec in (
select /*+
index(t_o)
*/
id_fk
from
t_o
) loop
update t_i&tabname t_i
set n = rec.id_fk
where id = rec.id_fk;
end loop;
insert into timings(testtype, thread_id, ts) values ('&testtype', &thread_id, systimestamp);
commit;
end loop;
end;
/
The setup of the tables T_O and T_I<n> was identical to the previous read-only test and can be checked in part 3 of this series. Again this was executed by several sessions concurrently, this time by 8 sessions on both the DBaaS database and the dedicated physical host - since this wasn't CPU bound and due to better write performance the dedicated physical host could keep up with the load at 8 sessions.
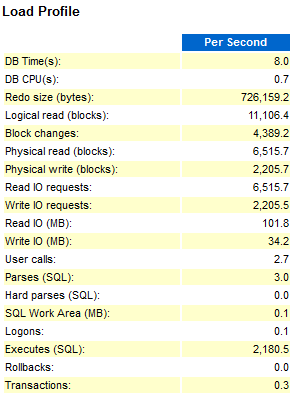
Due to the minimum buffer cache used, the way the data and test is crafted this setup puts maximum pressure of the DBWR background process, due to the constant need to read new blocks into the small buffer cache and write dirty blocks at the same time. By choosing a large block size of 16KB and at the same time using a very small actual change data volume the log writer didn't play a role in this test here. Both databases operated in NOARCHIVELOG mode and with Flashback disabled.
The test showed that for this setup the DBWR for the DBaaS database was not capable of writing the data fast enough, so that significant time was spent on "free buffer waits", waiting for the DBWR to free up buffers by writing dirty blocks to disk, amplified by the faster read I/O of the DBaaS service compared to the dedicated physical host. The DBaaS storage obviously is optimized for reads - having to write encrypted blocks makes things not faster - the dedicated physical host didn't use TDE encryption. In a separate Parallel Execution test the DBaaS service performed a maximum read throughput of 640 MB per second and 120 MB per second write throughput.
A sample AWR Top profile looked like this:
DBaaS:
Physical Host:
Unfortunately this test could only be executed for a couple of hours on the dedicated physical host and had then to be stopped due to technical problems, distorting some of the following charts.
The overall consistency graph looked like this:
DBaaS:
 Physical host:
DBaaS:
Again the graph is supposed to show how many of the runs deviated how much from the overall median runtime. Again the DBaaS service shows a significantly different profile, but this time performed more consistently than in the previous read-only test - the probable reason for the difference will be explained in a later part of this series. The DBaaS service this time had some extreme outliers (max. > 160 percent deviation) that I didn't include in the graph to not distort the graph too much - but it were just a few runs out of more than 25.000 that were affected.
The same data on per day (per hour for the physical host) basis:
DBaaS:
Physical host:
As mentioned above the physical host data covers only a few hours and hence can't really be compared to the DBaaS data covering more than a week of data.
Finally the individual thread performance:
DBaaS:
Physical host:
Both environments show pretty stable run times per thread over time, and the graphs confirm what is mentioned above: The physical host this time outperforms the DBaaS, however, as already mentioned, a slightly unfair comparison as the physical host didn't had to read and write encrypted blocks.
The next parts will cover comparisons to other cloud providers.
Sunday, September 25, 2016
Video Tutorial: XPLAN_ASH Active Session History - Part 12
The final part of the video tutorial explaining the XPLAN_ASH Active Session History functionality continuing the actual walk-through of the script output.
This is the final part of this tutorial, but there are more tutorials coming - about configuring the script, script internals and also the Rowsource Statistics mode of the script.
This is the final part of this tutorial, but there are more tutorials coming - about configuring the script, script internals and also the Rowsource Statistics mode of the script.
Sunday, September 18, 2016
Video Tutorial: XPLAN_ASH Active Session History - Part 11
The next part of the video tutorial explaining the XPLAN_ASH Active Session History functionality continuing the actual walk-through of the script output.
More parts to follow.
More parts to follow.
Sunday, September 11, 2016
Posts by Alberto Dell'Era On ASH Wait Times And Materialized Views
This is just a short note that links to different articles on Alberto Dell'Era's blog. Alberto is a long time member of the OakTable and has published a number of posts I find very useful and therefore are linked here:
ASH wait times (including an ASH simulator!)
Posts on Materialized Views
ASH wait times (including an ASH simulator!)
Posts on Materialized Views
Sunday, September 4, 2016
Video Tutorial: XPLAN_ASH Active Session History - Part 10
The next part of the video tutorial explaining the XPLAN_ASH Active Session History functionality continuing the actual walk-through of the script output.
More parts to follow.
More parts to follow.
Sunday, August 28, 2016
Oracle Database Cloud (DBaaS) Performance Consistency - Part 3
This is the third part of this installment, comparing the performance consistency of the DBaaS cloud offering with a dedicated physical host. This time instead of burning CPU using logical I/O only (see part 2) the test harness executes a SQL statement that has to perform physical I/O mostly, and to be more precise this round is a read-only test, so doesn't include any modification to data (except the logging and any other background system generated write activity, like maintaining ASH /AWR data etc.).
In order to maximize the physical I/O part the database instance was configured with a minimum sized buffer cache (16k block size in this case) and the following script was executed as many times as CPUs were available:
declare
n number;
begin
loop
select /*+
leading(t_o)
use_nl(t_i)
index(t_o)
index(t_i)
*/
sum(t_i.n)
into n
from
t_o
, t_i&tabname t_i
where
t_o.id_fk = t_i.id;
insert into timings(testtype, thread_id, ts) values ('&testtype', &thread_id, systimestamp);
commit;
end loop;
end;
/
The outer table T_O was created like this:
create table t_o (id primary key, id_fk)
organization index
as
select
rownum as id
, case mod(rownum, 2) + 1
when 1
then mod(rownum, &tab_size / 20)
else &tab_size / 10 - mod(rownum, &tab_size / 20) + 1
end as id_fk
from dual
connect by level <= &tab_size;
Each thread got its dedicated inner table of the Nested Loop join, created like this:
create table t_i' || i || ' (id not null, n, filler)
pctfree 99 pctused 1
tablespace &tbs
as
select cast(rownum as integer) as id,
cast(rownum as number) as n,
cast(rpad('x', 200) as varchar2(200)) as filler
from dual
connect by level <= &tab_size / 10;
create index t_i' || i || '_idx on t_i' || i || ' (id, filler) pctfree 99 tablespace &tbs;
Due to the way the data was crafted and thanks to the Nested Loop join batching performed by Oracle this ensured that the sessions were performing "db file parallel read" I/O as much and hard as possible, so were submitting multiple I/O requests using a single call and taking advantage of asynchronous I/O where possible.
When running with 8 threads on those 8 CPUs on the DBaaS service this resulted in approx. 30.000 IOPS for those 16K blocks (approx. 480MB / sec throughput). Note that I got these 30.000 IOPS for 16K blocks also on a different instance with just 4 CPUs (2 OCPUs) and 4 threads, so it looks like this is a common 16K blocks IOPS limit for a DBaaS instance independently from the CPU count without further tweaking (I didn't attempt to optimize this in any way but used the service as provided / configured by the Oracle Cloud). It looks like this is more a throughput limitation at 480MB / sec than an IOPS limitation, because when using a 4K blocksize I was able to get 60.000 IOPS (middle value), but the IOPS rate was much more fluctuating (between 20.000 and 90.000) whereas the 30.000 IOPS using 16K blocksize was pretty much stable.
On the physical host I got approx. half of these IOPS (roughly 15.500) for those 16K blocks (approx. 250MB / sec throughput), which is very likely the throughput limit for the rather outdated hardware configuration, albeit using a rather modern Samsung SSD drive, but also meant that running at 4 threads I got a comparable number of IOPS per thread as in the DBaaS setup. Using a 4K blocksize the physical host maxed out at (very stable) 52.000 IOPS.
The overall results look like this:
DBaaS:

Physical host:


In order to maximize the physical I/O part the database instance was configured with a minimum sized buffer cache (16k block size in this case) and the following script was executed as many times as CPUs were available:
declare
n number;
begin
loop
select /*+
leading(t_o)
use_nl(t_i)
index(t_o)
index(t_i)
*/
sum(t_i.n)
into n
from
t_o
, t_i&tabname t_i
where
t_o.id_fk = t_i.id;
insert into timings(testtype, thread_id, ts) values ('&testtype', &thread_id, systimestamp);
commit;
end loop;
end;
/
The outer table T_O was created like this:
create table t_o (id primary key, id_fk)
organization index
as
select
rownum as id
, case mod(rownum, 2) + 1
when 1
then mod(rownum, &tab_size / 20)
else &tab_size / 10 - mod(rownum, &tab_size / 20) + 1
end as id_fk
from dual
connect by level <= &tab_size;
Each thread got its dedicated inner table of the Nested Loop join, created like this:
create table t_i' || i || ' (id not null, n, filler)
pctfree 99 pctused 1
tablespace &tbs
as
select cast(rownum as integer) as id,
cast(rownum as number) as n,
cast(rpad('x', 200) as varchar2(200)) as filler
from dual
connect by level <= &tab_size / 10;
create index t_i' || i || '_idx on t_i' || i || ' (id, filler) pctfree 99 tablespace &tbs;
Due to the way the data was crafted and thanks to the Nested Loop join batching performed by Oracle this ensured that the sessions were performing "db file parallel read" I/O as much and hard as possible, so were submitting multiple I/O requests using a single call and taking advantage of asynchronous I/O where possible.
When running with 8 threads on those 8 CPUs on the DBaaS service this resulted in approx. 30.000 IOPS for those 16K blocks (approx. 480MB / sec throughput). Note that I got these 30.000 IOPS for 16K blocks also on a different instance with just 4 CPUs (2 OCPUs) and 4 threads, so it looks like this is a common 16K blocks IOPS limit for a DBaaS instance independently from the CPU count without further tweaking (I didn't attempt to optimize this in any way but used the service as provided / configured by the Oracle Cloud). It looks like this is more a throughput limitation at 480MB / sec than an IOPS limitation, because when using a 4K blocksize I was able to get 60.000 IOPS (middle value), but the IOPS rate was much more fluctuating (between 20.000 and 90.000) whereas the 30.000 IOPS using 16K blocksize was pretty much stable.
On the physical host I got approx. half of these IOPS (roughly 15.500) for those 16K blocks (approx. 250MB / sec throughput), which is very likely the throughput limit for the rather outdated hardware configuration, albeit using a rather modern Samsung SSD drive, but also meant that running at 4 threads I got a comparable number of IOPS per thread as in the DBaaS setup. Using a 4K blocksize the physical host maxed out at (very stable) 52.000 IOPS.
The overall results look like this:
DBaaS:
Physical host:
Again the graph is supposed to show how many of the runs deviated how much from the overall median runtime. Similar to the previous, logical I/O only test this time the DBaaS service shows a significantly different profile, with an even larger spread of deviation up to almost 9 percent from the median runtime, whereas the physical host only shows significant deviation up to 2.5 percent.
Again, like in the previous test, the physical host shows more extreme outliers than the DBaaS service.
The same graph on a per day basis this time shows significant differences between the days for the DBaaS service:
The same graph on a per day basis this time shows significant differences between the days for the DBaaS service:
The physical host shows a very common pattern, except for the first day:
Looking at the individual performance of each thread the DBaaS shows a significant variation in performance per day:
The physical host shows a pretty consistent performance pattern, but interestingly the different threads show different, but consistent runtimes:
The next test round will include physical writes.
Sunday, August 21, 2016
Adaptive Cursor Sharing Fail
Here is another example (besides the fact that Adaptive Cursor Sharing only gets evaluated during a PARSE call (still valid in 12c) and supports a maximum of 14 bind variables) I've recently come across at a client site where the default implementation of Adaptive Cursor Sharing fails to create a more suitable execution plan for different bind variable values.
Broken down to a bare minimum the query was sometimes executed using non-existing values for a particular bind variable, but other times these values were existing and very popular. There were two suitable candidate indexes and one of them appeared to the optimizer more attractive in case of the "non-existing" value case. Unfortunately this index was a very bad choice for the "existing and very popular" case.
The critical point of the case is that due to other, additional filters on the same table/index the final number of rows produced by the row source operation was (almost) the same for the "non-existing" and the "existing and very popular" case, but in the latter case a large proportion of the bad index had to be scanned due to the popularity of the bind value, which was the only predicate that could be used as ACCESS predicate and the additional ones could only be applied as FILTER on the index.
So although there was a suitable histogram available on the column in question and the optimizer in principle was aware of the different popularities of values and marked the cursor as "bind sensitive" it looks like when a cursor is then monitored it just is assigned to different buckets as exposed via V$SQL_CS_HISTOGRAM, based on the rows produced by the row source. Since the operation in question didn't differ much in the final number of rows produced between the two cases (either 0 rows or 1 row) the different executions were all assigned to the same bucket - although the amount of work required to produce this single row was huge, reflected in execution time and physical / logical I/Os performed per execution.
Obviously this vastly different amount of work performed to produce a similar number of rows is not used as criteria for marking a cursor as "bind aware" and evaluate different execution plans based on ranges of bind values.
There is a view V$SQL_CS_STATISTICS that includes information about CPU_TIME and BUFFER_GETS but in 11.2.0.4 it only reflects the initial execution when starting with the "non-existing" value case, but not the slow executions afterwards. In 12.1.0.2 the view is no longer populated at all, which suggests that this information is simply not used for deciding the "bind aware" status of a cursor.
Discussing the case with Mohamed Houri, who has spent significant time on investigating the "Adaptive Cursor Sharing" feature seemed to confirm this assumption.
Here is a simple test case that allows reproducing the issue:
-- FILTER1 is highly skewed (here one very popular value -1)
create table t
as
select
        rownum as id
      , rownum as n
      , case when rownum <= 100000 then rownum else -1 end as filter1
      , rownum as filter2
      , rpad('x', 200) as filler1
      , rownum as filter3
      , rpad('x', 200) as filler2
from
        dual
connect by level <= 1e6;

-- Histogram on FILTER1 should make the sample query "bind sensitive"
exec dbms_stats.gather_table_stats(null, 't', method_opt => 'for all columns size 1 for columns size 254 filter1')

-- The "good" index, ACCESS on all three columns
-- But higher BLEVEL (3) due to FILLER1 only one value and wide - needs to be part of every branch block
create index t_idx1 on t (filter1, filler1, filter2) compress 2 /*advanced low*/;

-- The "bad" index, ACCESS only on first column, FILTER on subsequent columns
-- But lower BLEVEL (2) due to FILTER3 before FILLER1, leads to much more compact branch blocks
create index t_idx2 on t (filter1, filter3, filler1, filler2, filter2) compress 1 /*advanced low*/;
The critical point is that the good index has a higher BLEVEL than the bad index. So in case a non-existing value for FILTER1 gets used the optimizer will favor the index with the lower BLEVEL, which is for that case the key cost component:
set echo on

-- Non-existing value
-- T_IDX2 gets preferred
explain plan for
select sum(n) from t where filter1 = -999999 and filler1 = rpad('x', 200) and filter2 = 999999;

select * from table(dbms_xplan.display);

-----------------------------------------------------------------------------------------------
| Id  | Operation                            | Name   | Rows  | Bytes | Cost (%CPU)| Time     |
-----------------------------------------------------------------------------------------------
|   0 | SELECT STATEMENT                     |        |     1 |   216 |     4   (0)| 00:00:01 |
|   1 |  SORT AGGREGATE                      |        |     1 |   216 |            |          |
|   2 |   TABLE ACCESS BY INDEX ROWID BATCHED| T      |     1 |   216 |     4   (0)| 00:00:01 |
|*  3 |    INDEX RANGE SCAN                  | T_IDX2 |     1 |       |     3   (0)| 00:00:01 |
-----------------------------------------------------------------------------------------------

Predicate Information (identified by operation id):
---------------------------------------------------

   3 - access("FILTER1"=(-999999) AND "FILLER1"='x

                                                                                         ' AND
              "FILTER2"=999999)
       filter("FILTER2"=999999 AND "FILLER1"='x

                                                                                      ')

-- Non-existing value
-- T_IDX1 has a higher cost
explain plan for
select /*+ index(t t_idx1) */ sum(n) from t where filter1 = -999999 and filler1 = rpad('x', 200) and filter2 = 999999;

select * from table(dbms_xplan.display);

-----------------------------------------------------------------------------------------------
| Id  | Operation                            | Name   | Rows  | Bytes | Cost (%CPU)| Time     |
-----------------------------------------------------------------------------------------------
|   0 | SELECT STATEMENT                     |        |     1 |   216 |     5   (0)| 00:00:01 |
|   1 |  SORT AGGREGATE                      |        |     1 |   216 |            |          |
|   2 |   TABLE ACCESS BY INDEX ROWID BATCHED| T      |     1 |   216 |     5   (0)| 00:00:01 |
|*  3 |    INDEX RANGE SCAN                  | T_IDX1 |     1 |       |     4   (0)| 00:00:01 |
-----------------------------------------------------------------------------------------------

Predicate Information (identified by operation id):
---------------------------------------------------

   3 - access("FILTER1"=(-999999) AND "FILLER1"='x

                                                                                         ' AND
              "FILTER2"=999999)

-- Existing and very popular value
-- T_IDX1 gets preferred
explain plan for
select sum(n) from t where filter1 = -1 and filler1 = rpad('x', 200) and filter2 = 999999;

select * from table(dbms_xplan.display);

-----------------------------------------------------------------------------------------------
| Id  | Operation                            | Name   | Rows  | Bytes | Cost (%CPU)| Time     |
-----------------------------------------------------------------------------------------------
|   0 | SELECT STATEMENT                     |        |     1 |   216 |     5   (0)| 00:00:01 |
|   1 |  SORT AGGREGATE                      |        |     1 |   216 |            |          |
|   2 |   TABLE ACCESS BY INDEX ROWID BATCHED| T      |     1 |   216 |     5   (0)| 00:00:01 |
|*  3 |    INDEX RANGE SCAN                  | T_IDX1 |     1 |       |     4   (0)| 00:00:01 |
-----------------------------------------------------------------------------------------------

Predicate Information (identified by operation id):
---------------------------------------------------

   3 - access("FILTER1"=(-1) AND "FILLER1"='x

                                                                                    ' AND
              "FILTER2"=999999)


-- Existing and very popular value
-- T_IDX2 is a bad idea, correctly reflected in the cost estimate
explain plan for
select /*+ index(t t_idx2) */ sum(n) from t where filter1 = -1 and filler1 = rpad('x', 200) and filter2 = 999999;

select * from table(dbms_xplan.display);

-----------------------------------------------------------------------------------------------
| Id  | Operation                            | Name   | Rows  | Bytes | Cost (%CPU)| Time     |
-----------------------------------------------------------------------------------------------
|   0 | SELECT STATEMENT                     |        |     1 |   216 | 58269   (1)| 00:00:03 |
|   1 |  SORT AGGREGATE                      |        |     1 |   216 |            |          |
|   2 |   TABLE ACCESS BY INDEX ROWID BATCHED| T      |     1 |   216 | 58269   (1)| 00:00:03 |
|*  3 |    INDEX RANGE SCAN                  | T_IDX2 |     1 |       | 58268   (1)| 00:00:03 |
-----------------------------------------------------------------------------------------------

Predicate Information (identified by operation id):
---------------------------------------------------

   3 - access("FILTER1"=(-1) AND "FILLER1"='x

                                                                                    ' AND
              "FILTER2"=999999)
       filter("FILTER2"=999999 AND "FILLER1"='x

                                                                                      ')
So when optimizing for the two different cases the optimizer does the right thing and understands that for the case "existing and very popular" T_IDX2 is a bad choice. It's also obvious from the "Predicate Information" section that the index T_IDX2 only can use FILTER1 as ACCESS predicate.
But when using bind variables the different cases are not recognized and the bad index is used for both cases when the optimization is based on the "non-existing value" case:
-- Default behaviour, although being BIND_SENSITIVE thanks to the histogram, no ACS kicks in
-- The V$SQL_CS_HISTOGRAM shows all executions being in bucket 0, so according to BIND_SENSITIVE monitoring no need for action
set echo on timing on time on

alter session set statistics_level = all;

variable n number

exec :n := -999999

declare
  res number;
begin
  select sum(n) into res from t where filter1 = :n and filler1 = rpad('x', 200) and filter2 = 999999;
end;
/

exec :n := -1

declare
  res number;
begin
  for i in 1..1000 loop
    select sum(n) into res from t where filter1 = :n and filler1 = rpad('x', 200) and filter2 = 999999;
  end loop;
end;
/

SQL> alter session set statistics_level = all;

Session altered.

Elapsed: 00:00:00.03
SQL>
SQL> variable n number
SQL>
SQL> exec :n := -999999

PL/SQL procedure successfully completed.

Elapsed: 00:00:00.03
SQL>
SQL> declare
  2    res number;
  3  begin
  4    select sum(n) into res from t where filter1 = :n and filler1 = rpad('x', 200) and filter2 = 999999;
  5  end;
  6  /

PL/SQL procedure successfully completed.

Elapsed: 00:00:00.28
SQL>
SQL> exec :n := -1

PL/SQL procedure successfully completed.

Elapsed: 00:00:00.04
SQL>
SQL> declare
  2    res number;
  3  begin
  4    for i in 1..1000 loop
  5      select sum(n) into res from t where filter1 = :n and filler1 = rpad('x', 200) and filter2 = 999999;
  6    end loop;
  7  end;
  8  /

PL/SQL procedure successfully completed.

Elapsed: 00:04:48.64
SQL>

-- With BIND_AWARE a second child cursors gets generated and used on second parse, interesting
set echo on timing on time on

alter session set statistics_level = all;

variable n number

exec :n := -999999

declare
  res number;
begin
  select /*+ bind_aware */ sum(n) into res from t where filter1 = :n and filler1 = rpad('x', 200) and filter2 = 999999;
end;
/

exec :n := -1

declare
  res number;
begin
  for i in 1..1000 loop
    select /*+ bind_aware */ sum(n) into res from t where filter1 = :n and filler1 = rpad('x', 200) and filter2 = 999999;
  end loop;
end;
/

SQL> alter session set statistics_level = all;

Session altered.

Elapsed: 00:00:00.03
SQL>
SQL> variable n number
SQL>
SQL> exec :n := -999999

PL/SQL procedure successfully completed.

Elapsed: 00:00:00.03
SQL>
SQL> declare
  2    res number;
  3  begin
  4    select /*+ bind_aware */ sum(n) into res from t where filter1 = :n and filler1 = rpad('x', 200) and filter2 = 999999;
  5  end;
  6  /

PL/SQL procedure successfully completed.

Elapsed: 00:00:00.04
SQL>
SQL> exec :n := -1

PL/SQL procedure successfully completed.

Elapsed: 00:00:00.03
SQL>
SQL> declare
  2    res number;
  3  begin
  4    for i in 1..1000 loop
  5      select /*+ bind_aware */ sum(n) into res from t where filter1 = :n and filler1 = rpad('x', 200) and filter2 = 999999;
  6    end loop;
  7  end;
  8  /

PL/SQL procedure successfully completed.

Elapsed: 00:00:00.20
SQL>

-- Or hinting for a fixed plan helps, too
set echo on timing on time on

alter session set statistics_level = all;

variable n number

exec :n := -999999

declare
  res number;
begin
  select /*+ index(t t_idx1) */ sum(n) into res from t where filter1 = :n and filler1 = rpad('x', 200) and filter2 = 999999;
end;
/

exec :n := -1

declare
  res number;
begin
  for i in 1..1000 loop
    select /*+ index(t t_idx1) */ sum(n) into res from t where filter1 = :n and filler1 = rpad('x', 200) and filter2 = 999999;
  end loop;
end;
/
Executing the unhinted, default case leads to a very inefficient execution of the thousand executions using the popular value (and the actual table / index at the client site was much larger than this example and the query got executed very frequently) - compare that to the execution time for the other two variants, either using the BIND_AWARE hint or simply requesting the good index.
So when requesting to mark the cursor immediately BIND_AWARE via the corresponding hint (only possible if the cursor qualifies to be bind sensitive) Oracle happily generates a second child cursor at the second PARSE call with a different, more efficient execution plan for the popular value, because when a cursor is marked bind aware a completely different algorithm gets used that is based on range of values as exposed via V$SQL_CS_SELECTIVITY, and since the different values are falling into different ranges of values a new plan gets generated that is different from the previous one and hence gets used from then on for those (range of) values.
Subscribe to:
Posts (Atom)

