Showing posts with label 11gR2. Show all posts

Wednesday, May 1, 2019

I/O Benchmark Minor Update

I've recently published a new version 1.03 of the I/O benchmark scripts on my github repository (ideally pick the IO_BENCHMARK.ZIP containing all the scripts). The original post including some more instructions can be found here, and there is also a video on my Youtube channel explaining how to use the benchmark scripts.

The main change is a new version of the "Write IOPS" benchmark that should scale much better than the older version.

There are now actually two variants of the "max_write_iops_benchmark_slave.sql" script. The currently used one is based on a batch SQL update whereas the "max_write_iops_benchmark_slave_forall.sql" script uses a PL/SQL FORALL update approach to achieve the same. In my tests the two performed quite similarly, but I've decided to include both so you can test which one works better for you - just rename the scripts accordingly.


In order to max out "Write IOPS" I suggest you create objects that are smaller than the corresponding buffer cache so can be cached entirely and set FAST_START_MTTR_TARGET to 1 to maximize the write pressure on the DBWR process(es). The Online Redo Logs should be sized adequately in order to avoid bottlenecks in that area. The script is designed to minimize redo generation and maximize the number of blocks modified that have then to be written by DBWR.


You could still run the script in a mixed read/write IOPS mode if you create objects larger than the buffer cache - in which case there can be additional pressure on the DBWR if there are no free buffers to read in new blocks ("free buffer waits"). I've also already used successfully both the "Read IOPS" and "Write IOPS" benchmark scripts simultaneously to maximize both, read and write IOPS.


There is still the problem at least in 12.2 (and I think it's still there in 18c but not entirely sure off the top of my head) that the PDB level AWR reports don't cover properly the DBWR "Write I/O" related figures, so although the script specifically detects that it runs on 12.2+ and on PDB level and creates AWR PDB reports accordingly you won't get any useful "Write IOPS" results and would have to either run the benchmark on CDB level or create CDB level AWR snapshots accordingly.


The interactive scripts now also echo the command finally called to execute the actual benchmark script, which can be helpful if you don't want to go through the interactive script again and again for repeated executions. Of course you still would need to take care of dropping / creating / keeping a suitable schema where to execute the benchmark, and maybe also modify the scripts that they don't keep creating and dropping the objects if you want have multiple runs with same object size / concurrency settings.

I'm thinking about a version 2.0 of the I/O benchmark scripts that should be improved in various aspects - the "interactive" script should become much more user friendly with improved defaults and abbreviations that can be entered, and more options like keeping the schema / objects. Also the measurement of the IOPS / throughput should be improved by monitoring the figures continuously which should provide a much better picture of the performance over time (varying IOPS rates for example). The core I/O benchmark scripts seem to be working pretty well (now that the write IOPS is improved) so I don't see much need for improvement there. Maybe an option to execute the benchmark in a kind of loop with increasing object sizes / concurrency level might also be useful.

Wednesday, March 14, 2018

No Asynchronous I/O When Using Shared Server (Also Known As MTS)

I've recently had a case at a client where it was questioned why a particular application was seemingly not making full use of the available I/O capabilities - in comparison to other databases / applications using similar storage.

Basically it ended up in a kind of finger pointing between the application vendor and the IT DBA / storage admins, one side saying that the infrastructure used offers insufficient I/O capabilities (since the most important application tasks where dominated by I/O waits in the database), and the other side saying that the application doesn't make use of the I/O capabilities offered - compared to other databases / applications that showed a significantly higher IOPS rate and/or I/O throughput using the same kind of storage.

At the end it turned out that in some way both sides were right, because the application made use of a somewhat unusual configuration for batch processing: Due to very slow Dedicated Server connection establishment that slowed down some other, more interactive part of the application, the database and client connection strings were configured to use Shared Server connections by default for all parts of the application. This successfully solved the connection establishment problem but obviously introduced another, so far not recognized problem.

Using my recently published I/O benchmark we performed some tests to measure the maximum IOPS and throughput of that specific database independently from the application, and the results were surprising, because in particular the test variations that were supposed to perform asynchronous physical read single block ("db file parallel read") and multi block I/O ("direct path read") didn't do so, but showed synchronous I/O only ("db file sequential read" / "db file scattered read").

After some investigations it became obvious the reason for this behaviour was the usage of the Shared Server architecture - simply switching to Dedicated Server sessions showed the expected behaviour and also a significantly higher maximum IOPS rate and I/O throughput at the same level of concurrency.

It's very easy to reproduce this, using for example my read IOPS and throughput benchmark scripts and performing the benchmark using either Shared or Dedicated Server architecture in asynchronous I/O mode.

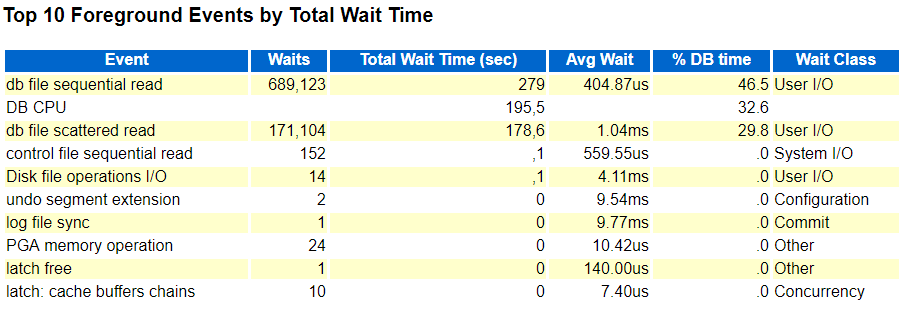
For example, this is what I get running this on my laptop using Dedicated Server and testing maximum read I/O throughput in asynchronous I/O mode (which should result in "direct path read" operations bypassing the buffer cache):


If I repeat exactly the same test (same settings, number of processes, size of objects etc.) using Shared Server architecture, this is what I get:


This is particularly interesting - no direct path reads although the benchmark sessions set in this case "_serial_direct_read" = 'always'.

In principle the same can be seen when running the maximum read IOPS benchmark, here is the expected result when using Dedicated Servers in asynchronous I/O mode:


And again, this is what I get when running the same test using Shared Servers:


Again no sign of asynchronous I/O ("db file parallel read") - and the achieved IOPS rate is significantly lower, which is exactly what the client experienced, much more DB time waiting for I/O and less time spent on CPU than expected. Depending on the particular storage configuration and latency the difference when using the same number of processes can be even more significant, I've seen up to factor 20 difference in achieved IOPS rate, and factor 3 to 4 is quite typical. Of course as usual how relevant this really is all depends on the actual query, execution plan and data pattern and where most of the time is spent.

Also, it is important to point out that all this might not be too relevant to most configurations, since Shared Servers aren't used that much nowadays in the times of application servers / connection pools dominating typical environments. Also it's probably rather uncommon to use Shared Servers for batch processing tasks like this client did.

Although Shared Servers were originally designed for typical OLTP applications having many open sessions being idle most of the time and performing mostly very simple and straightforward operations (like looking up a few rows via an efficient index access path) it's still interesting to see this limitation that can be quite significant depending on the I/O patterns used. So far I've not seen this documented anywhere, also on MyOracleSupport I couldn't find any matching notes describing the behaviour, and unfortunately no Service Request was opened for the issue yet.

When using Parallel Execution, by the way, which is also very unlikely when using Shared Servers but perfectly possible (the Shared Server session then acts as Query Coordinator), the Parallel Servers can make use of asynchronous I/O - so the limitation only seems to apply to the Shared Server session itself. I can think of some reasons why this limitation could be explained from an implementation point of view the way Shared Servers work, but this is of course only speculation.

All currently relevant versions show the same behaviour in that regard, by the way. I've reproduced this on 11.2.0.4, 12.1.0.2 and 12.2.0.1 on Windows as well as on Linux.

Wednesday, March 7, 2018

Oracle Database Physical I/O IOPS And Throughput Benchmark

General Information

I've used a similar set of scripts quite a few times now to provide feedback to customers that wanted to get a more realistic picture of the I/O capabilities from a database perspective, rather than relying on artificial benchmarks performed outside - or even inside, think of I/O calibration - the database. Although there are already several Oracle benchmark toolkits available, like Swingbench and in particular SLOB, that run inside the database I was looking for a very simplistic and straightforward I/O benchmark that comes with minimum overhead and in principle allows maximizing I/O from the database perspective, so using regular Oracle database codepaths based on SQL execution plans, I/O calls performed as part of that, involving the database buffer cache where applicable and in particular supports focusing on specific I/O patterns (which might be unique to this benchmark toolkit). Therefore I've developed a set of simple scripts that support in total four different I/O tests:

- Single and multi block physical reads

- Single and multi block physical writes

In case of the physical read tests support for synchronous and asynchronous reads is provided, which can be controlled via a corresponding input / parameter to the script.

In terms of instrumentation / internal implementation this corresponds to:

- synchronous single block reads: "db file sequential read" / "cell single block physical read" on Exadata

- asynchronous single block reads: "db file parallel read" / "cell list of blocks physical read" on Exadata

- synchronous multi block reads: "db file scattered read" / "cell multiblock physical read" on Exadata

- asynchronous multi block reads: "direct path read" / "cell smart table/index scan" on Exadata

The physical write tests should mainly trigger "db file parallel write" in case of the single block writes and "direct path write" in case of the multi block writes. Of course when it comes to DML activity things get more complicated in terms of the actual database activity triggered, in particular the additional undo / redo / archiving / potential standby activity. Note that if you're using an auto-extensible Undo tablespace configuration, running the single block physical write tests might increase the size of your Undo tablespace - you have been warned.

So each I/O test generates a specific I/O pattern (except for the single block write test that can also trigger synchronous single block reads, see the script for more details). The basic idea is to run just one of the tests to maximize the specific I/O pattern, but of course nothing stops you from running several of the tests at the same time  (would require different schemas to use for each test because otherwise object names dropped / created will collide / overlap) which will result in a mixture of I/O patterns. There is no synchronisation though in terms of starting / stopping / generating performance report snapshots etc. when running multiple of these tests at the same time, so you would probably have to take care of that yourself. So far I've not tested this, so it might not work out as just described.

In case of the physical read tests (except for the asynchronous "direct path read" that bypasses the buffer cache by definition) using too small objects / a too large buffer cache can turn this into a CPU / logical I/O test instead, so in principle you could use those tests for generating mainly CPU load instead of physical I/O (and provided the physical I/O is quick enough the CPU usage will be significant anyway), but that is not the intended usage of the scripts.

The scripts allow control over the size of the objects created and also support placing in specific buffer caches via the STORAGE clause (like RECYCLE or KEEP cache), so it is up to you to create objects of a suitable size depending on your configuration and intended usage.

Usage

Update: I've published a tutorial on my Youtube channel how to use the scripts.

Please note - the scripts are freely available and come with no warranty at all - so please use at your own risk.

In principle the scripts can be downloaded from my github repository - ideally pick the IO_BENCHMARK.ZIP which contains all required scripts, and should simply be extracted into some directory. Since the four different I/O tests are so similar, there is a subdirectory "common" under "io_benchmark" that holds all the common script parts and the main scripts then just call these common scripts where applicable.

The benchmark scripts consist of four similar sets:

max_read_iops_benchmark*: Single block reads synchronous / asynchronous

max_read_throughput_benchmark*: Multi block reads synchronous / asynchronous

max_write_iops_benchmark*: Single block writes - optionally mixed with synchronous single block reads (depends on object vs. buffer cache size)

max_write_throughput_benchmark*: Multi block direct writes

Each set consists of three scripts - an interactive guided script prompting for inputs used as parameters for the actual benchmark harness that in turn will launch another "slave" script as many times as desired to run the concurrent benchmark code.

There are in principle two different ways how the scripts can be used:

1. For each set there is a script that is supposed to be used from a SYSDBA account and guides through the different options available (*interactive). It will drop and re-create a schema to be used for the benchmark and grant the minimum privileges required to create the objects and run the benchmark. At the end of this interactive script it will connect as the user just created and run the benchmark. You can also use this script to clean-up afterwards, which is dropping the user created and stopping the script at that point.

2. The interactive script just calls the main benchmark harness with the parameters specified, so if you already have everything in place (check the "interactive_create_user.sql" in the "common" script subdirectory for details what privileges are required) to run the benchmark you can simply connect as the intended user, call the actual benchmark script and specify the parameters as desired - it will use defaults for any parameter not explicitly specified - check the script header for more details. Please note that I haven't tested running the actual benchmark as SYS respectively SYSDBA and I wouldn't recommend doing so. Instead use a dedicated user / schema as created by the interactive script part.

Each set of scripts consists of a third script which is the "slave" script being called as many times concurrently as specified to perform the actual benchmark activity.

The scripts will generate objects, typically as part of the preparation steps before the actual concurrent benchmark activity starts, or in case of the multi block write test, the object creation is the actual benchmark activity.

After the benchmark ran for the specified amount of time (600 seconds / 10 minutes default) the "slaves" will be shut down (if they haven't done so automatically) and the corresponding information about the IOPS / throughput rate achieved will be shown, based on (G)V$SYSMETRIC_HISTORY, so at least 120 seconds of runtime are required to have this final query to show something meaningful (to ensure that at least one 60 seconds interval is fully covered).

In addition the script by default will generate performance report snapshots (either AWR or STATSPACK) and display the corresponding report at the end. The file name generated describes the test performed along with the most important parameters (parallel degree, I/O mode (sync / async), object size, duration, timestamp etc.) Note that the script on Unix/Linux makes use of the "xdg-open" utility to open the generated report, so the "xdg-utils" package would be required to be installed to have this working as intended.

Note that in 12.2.0.1 the PDB level reports and metrics seem to miss "physical single block writes" performed by the DB Writer, so effectively evaluating / running this benchmark in 12.2.0.1 on PDB level won't report anything meaningful - you would have to resort to reports on CDB level instead, which I haven't implemented (actually I had to put in some effort to use the PDB level AWR reports and metrics in 12.2, so hopefully Oracle will fix this in future versions).

Finally the benchmark script will clean up and drop the objects created for the benchmark.

In principle the benchmark scripts should cope with all kinds of configurations: Windows / Unix / Linux, Single Instance / RAC, Standard / Enterprise Edition, PDB / Non-PDB, Non-Exadata / Exadata, and support versions from 11.2.0.4 on. It might run on lower versions, too, but not tested, and of course 18c (12.2.0.2) is not available on premises yet at the time of writing this, so not tested either.

But since this is an initial 1.0 version it obviously wasn't tested in all possible combinations / configurations / parameter settings, so expect some glitches. Feedback and ideas how to improve are welcome.

Where applicable the benchmark harness script also generates two tables EVENT_HISTOGRAM_MICRO1 and EVENT_HISTOGRAM_MICRO2 which are snapshots of GV$EVENT_HISTOGRAM_MICRO available from 12.1 on for synchronous single / multi block reads. The "harness" scripts provide a suitable query in the script header to display the latency histogram information nicely.

Happy I/O benchmarking!

Monday, December 12, 2016

Queue-based Concurrent Stats Prototype Implementation

This is just a prototype of a queue-based concurrent statistics implementation - using the same basic implementation I've used a a couple of years ago to create indexes concurrently.

There are reasons why such an implementation might be useful - in 11.2.0.x the built-in Concurrent Stats feature might turn out to be not really that efficient by creating lots of jobs that potentially attempt to gather statistics for different sub-objects of the same table at the same time - which can lead to massive contention on Library Cache level due to the exclusive Library Cache locks required by DDL / DBMS_STATS calls.

In 12.1 the Concurrent Stats feature obviously got a major re-write by using some more intelligent processing what and how should be processed concurrently - some of the details are exposed via the new view DBA_OPTSTAT_OPERATION_TASKS, but again I've seen it running lots of very small jobs serially one of the other in the main session which can be a performance problem if the sheer number of objects to analyze is huge.

This prototype here tries to work around these problems by using a queue-based approach for true concurrent processing in combination with an attempt to use some "intelligent" ordering of the objects to analyze in the hope to minimize contention on Library Cache level.

This prototype determines the objects to gather statistics on by calling DBMS_STATS.GATHER_DATABASE_STATS using one of the available LIST* options - so it's supposed to replace a call to GATHER_DATABASE_STATS or the built-in default nightly statistics job.

The jobs for concurrent stats gathering are created using DBMS_SCHEDULER and a custom job class, which offers the feature of binding the jobs to a specific service, which can come handy if you for example want these jobs only to execute on certain node(s) in a RAC cluster database.

It comes with the following (known) limitations:

- The current implementation offers only rudimentary logging to a very simple log table, which also gets truncated at the start of each run, so no history from previous runs gets retained. In 12c this is not such an issue since DBA_OPTSTAT_OPERATION_TASKS contains a lot of details for each individual stats gathering call.

- Currently only objects of type TABLE returned by GATHER_DATABASE_STATS are considered assuming the CASCADE option will take care of any indexes to gather statistics for

- The default behaviour attempts to make use of all available CPUs of a single node by starting as many threads as defined via CPU_COUNT. If you explicitly specify the number of concurrent threads the default behaviour is to use a DEGREE (or DOP) per gather stats operation that again makes use of all available CPU resources by using a DEGREE = CPU_COUNT divided by number_of_threads. If you don't want that you will have to specify the DEGREE / DOP explicitly, too

- I haven't spend time to investigate how this behaves with regards to incremental statistics - since it's possible that GLOBAL and (sub-)partition statistics of the same object get gathered in different jobs, potentially at the same time and in random order (so GLOBAL prior to partition for example) the outcome and behaviour with incremental statistics turned on could be a problem

More details can be found in the comments section of the code, in particular what privileges might be required and how you could replace the default statistics job if desired.

The script provided includes a de-installation and installation part of the code. All that needs to be called then to start a database-wide gather statistics processing is the main entry point "pk_stats_concurrent.stats_concurrent" using any optional parameters as desired - consider in particular the parameters to control the number of threads and the intra-operation DOP as just outlined. See the code comments for a detailed description of the available parameters.
--------------------------------------------------------------------------------
--
-- Script:       pk_stats_concurrent.sql
--
-- Author:       Randolf Geist
--
-- Copyright:    http://oracle-randolf.blogspot.com
--
-- Purpose:      A queue based concurrent stats implementation - installation script
--
-- Usage:        @pk_stats_concurrent
--
--               The script will first drop all objects (can be skipped)
--
--               And then attempt to create the objects required (can be skipped)
--
--------------------------------------------------------------------------------

spool pk_stats_concurrent.log

prompt Concurrent Stats - Deinstallation
prompt *----------------------------------------------------*
prompt This script will now attempt to drop the objects
prompt belonging to this installation
accept skip_deinstall prompt 'Hit Enter to continue, CTRL+C to cancel or enter S to skip deinstall: '

set serveroutput on

declare
  procedure exec_ignore_fail(p_sql in varchar2)
  as
  begin
    execute immediate p_sql;
  exception
  when others then
    dbms_output.put_line('Error executing: ' || p_sql);
    dbms_output.put_line('Error message: ' || SQLERRM);
  end;
begin
  if upper('&skip_deinstall') = 'S' then
    null;
  else
    exec_ignore_fail('begin pk_stats_concurrent.teardown_aq; end;');
    exec_ignore_fail('drop table stats_concurrent_log');
    exec_ignore_fail('drop type stats_concurrent_info force');
    exec_ignore_fail('drop package pk_stats_concurrent');
    exec_ignore_fail('begin dbms_scheduler.drop_job_class(''CONC_STATS''); end;');
  end if;
end;
/

prompt Concurrent Stats - Installation
prompt *----------------------------------------------------*
prompt This script will now attempt to create the objects
prompt belonging to this installation
PAUSE  Hit CTRL+C to cancel, ENTER to continue...

/**
  * The log table for minimum logging of the concurrent execution threads
  * Since we cannot access the DBMS_OUTPUT of these separate processes
  * This needs to be cleaned up manually if / when required
  **/
create table stats_concurrent_log (log_timestamp timestamp, sql_statement clob, message clob);

/**
  * The single object type used as payload in the AQ queue for concurrent execution
  * Each message will have a description of the index plus the actual DDL text as payload
  **/
create or replace type stats_concurrent_info as object
(
  ownname                        varchar2(30)
, tabname                        varchar2(30)
, partname                       varchar2(30)
, degree                         number
, granularity                    varchar2(30)
);
/

show errors

create or replace package pk_stats_concurrent authid current_user
as

  ------------------------------------------------------------------------------
  -- $Id$
  ------------------------------------------------------------------------------

  /**
   * PK_STATS_CONCURRENT.SQL
   *
   * Created By    : Randolf Geist (http://oracle-randolf.blogspot.com)
   * Creation Date : 31-OCT-2016
   * Last Update   : 06-DEC-2016
   * Authors       : Randolf Geist (RG)
   *
   * History       :
   *
   * When        | Who | What
   * ----------------------------------
   * 31-OCT-2016 | RG  | Created
   * 06-DEC-2016 | RG  | This header comment updated
   *
   * Description   :
   *
   * This is a simple prototype implementation for the given task of gathering database stats
   * concurrently, in case you are not satisfied with the built-in concurrent stats option available since 11.2.0.x
   *
   * In 11.2, the CONCURRENT stats option creates as many jobs as there are objects to gather
   * And the JOB_QUEUE_PROCESSES parameter then controls the number of concurrent jobs running
   * Since the ordering of execution isn't really optimized, many of these concurrent jobs might attempt to gather stats on the same object in case it is (sub)partitioned
   * This can lead to significant contention on Library Cache level (due to exclusive Library Cache Locks required by DDL / DBMS_STATS)
   *
   * In 12.1 the CONCURRENT stats option was obviously completed rewritten and uses some more intelligent processing
   * by calculating if and yes how many jobs should run concurrently for what kind of objects (see for example the new DBA_OPTSTAT_OPERATION_TASKS view that exposes some of these details)
   * Still I've observed many occasions with this new implementation where lots of objects were deliberately gathered in the main session
   * one after the other which doesn't really make good use of available resources in case many objects need to be analyzed
   *
   * This implementation tries to work around these points by using a simple queue-based approach for true concurrent stats processing
   * combined with an attempt to distribute the tables to analyze across the different threads in a way that minimizes the contention on Library Cache level
   *
   * It needs to be installed / executed under a suitable account that has the privileges to create queues, types, packages, tables, jobs and job classes and gather stats on the whole database
   *
   * A sample user profile could look like this:

   create user conc_stats identified by conc_stats;

   grant create session, create table, create procedure, create type, create job, manage scheduler, analyze any, analyze any dictionary to conc_stats;

   grant execute on sys.dbms_aq to conc_stats;

   grant execute on sys.dbms_aqadm to conc_stats;

   grant select on sys.v_$parameter to conc_stats;

   alter user conc_stats default tablespace users;

   alter user conc_stats quota unlimited on users;

   * Parameters to be checked, depending on concurrency desired:
   *
   * job_queue_processes: Needs to be set high enough to accommodate for the concurrent stats threads spawned. By default this package spawns CPU_COUNT concurrent threads
   * parallel_max_servers: If a stats thread is supposed to use Parallel Execution (degree > 1) for gathering stats you'll need at least threads * degree Parallel Slaves configured
   * services: It's possible to specify a service to have the stats threads only executed on RAC nodes that run that service
   *
   * The jobs are created under the same job class, currently hard coded value CONC_STATS - this makes the handling easier in case you want to stop / drop the jobs submitted manually
   *
   * The job class name can be passed to calls to DBMS_SCHEDULER.DROP_JOB or STOP_JOB - remember that job classes are owned by SYS, so you have to specify SYS.CONC_STATS for the job class name used here
   *
   * The main entry point STATS_CONCURRENT is all you need to call to start concurrent stats gathering on the database
   * similar to GATHER_DATABASE_STATS using one of the options GATHER, GATHER STALE or GATHER AUTO (default) - here you have to use LIST EMPTY, LIST STALE or LIST AUTO (default)
   *
   * The default behaviour when not specifying any parameters is to start as many threads as there are CPUs by using the CPU_COUNT parameter
   * If you want this to be multiplied by the number of instances in a RAC cluster uncomment the CLUSTER_DATABASE_INSTANCES reference below in the code (assuming same CPU_COUNT on all nodes)
   *
   * This also means that the "intra" parallelism per gather_table_stats call will be one in such a case since the intra parallelism is calculated by default as CPU_COUNT / number of threads
   *
   * If you don't want to have that many threads / PX slaves started, specify the number of concurrent threads and an intra-operation DOP explicitly when calling STATS_CONCURRENT
   *
   * If you want to replace the default nightly stats job with this here, the following steps should achieve this:

   BEGIN DBMS_AUTO_TASK_ADMIN.disable(
     client_name => 'auto optimizer stats collection',
     operation   => NULL,
     window_name => NULL);
   END;

   BEGIN DBMS_SCHEDULER.CREATE_JOB(
     job_name => '',
     schedule_name => 'MAINTENANCE_WINDOW_GROUP',
     job_type => 'PLSQL_BLOCK',
     job_action => 'begin pk_stats_concurrent.stats_concurrent(); end;',
     comments => 'auto optimizer stats collection replacement using concurrent stats operations based on AQ'
     enabled => true);
   END;

   * Please ensure the job is submitted under the account it's supposed to be run - using a different account like SYS to submit the job for a different schema
   * seems to cause problems with privileges (insufficient privileges error messages), at least this was reported to me
   *
   * The code at present only processes objects of type TABLE returned by GATHER_DATABASE_STATS but not indexes
   * assuming that these should be covered by the CASCADE functionality
   *
   * Note: This script is a prototype and comes with NO warranty. Use at your own risk and test/adjust in your environment as necessary
   *       before using it in any production-like case
   *
   * @headcom
   **/

  subtype oracle_object      is varchar2(30);

  /**
   * Let the procedure stats_concurrent decide itself which degree to use.
   * At present this means simply to spawn as many child threads as defined by the CPU_COUNT parameter
   **/
  G_AUTO_PARALLEL_DEGREE            constant integer       := null;

  /**
   * The main entry point to gather statistics via parallel threads / AQ
   * @param p_parallel_degree The number of threads to start G_AUTO_PARALLEL_DEGREE means use the CPU_COUNT parameter to determine number of threads automatically
   * @param p_intra_degree The DOP to use per stats operation, by default calculate DOP based on CPU_COUNT and number of threads to run concurrently (Default DOP = CPU_COUNT / number of threads)
   * @param p_service Specify a service if you want the jobs to be assigned to that particular service, default NULL
   * @param p_gather_option What to pass to GATHER_DATABASE_STATS as option, default LIST AUTO
   * @param p_optional_init Optionally a SQL can be passed usually used to initialize the session
            for example forcing a particular parallel degree
   **/
  procedure stats_concurrent(
    p_parallel_degree in integer  default G_AUTO_PARALLEL_DEGREE
  , p_intra_degree    in integer  default null
  , p_service         in varchar2 default null
  , p_gather_option   in varchar2 default 'LIST AUTO'
  , p_optional_init   in varchar2 default null
  );

  /**
   * Setup the AQ infrastructure (Queue tables, Queues)
   **/
  procedure setup_aq;

  /**
   * Teardown the AQ infrastructure (Queue tables, Queues)
   **/
  procedure teardown_aq;

  /**
   * Helper function to populate the AQ queue with data to process
   * @param p_gather_option What to pass to GATHER_DATABASE_STATS as option, default LIST AUTO
   **/
  function list_stale_database_stats (
    p_gather_option    in  varchar2 default 'LIST AUTO'
  )
  return dbms_stats.objecttab pipelined;

  /**
   * Populate the AQ queue with data to process
   * @param p_parallel_degree The number threads to use - will be used for proper data preparation / queueing order
   * @param p_intra_degree The DOP to use per stats operation, by default calculate DOP based on CPU_COUNT and number of threads to run concurrently
   * @param p_gather_option What to pass to GATHER_DATABASE_STATS as option, default LIST AUTO
   **/
  procedure populate_queue(
    p_parallel_degree in integer
  , p_intra_degree    in integer default null
  , p_gather_option   in varchar2 default 'LIST AUTO'
  );

  /**
   * This gets called for every stats thread
   * It pulls the object to gather from the AQ queue
   * @param p_optional_init Optionally a SQL can be passed usually used to initialize the session
            for example forcing a particular parallel degree
   **/
  procedure stats_thread(
    p_optional_init         in varchar2 default null
  );

end pk_stats_concurrent;
/

show errors

create or replace package body pk_stats_concurrent
as
  ------------------------------------------------------------------------------
  -- $Id$
  ------------------------------------------------------------------------------

  /**
   * PK_STATS_CONCURRENT.SQL
   *
   * Created By    : Randolf Geist (http://oracle-randolf.blogspot.com)
   * Creation Date : 31-OCT-2016
   * Last Update   : 06-DEC-2016
   * Authors       : Randolf Geist (RG)
   *
   * History       :
   *
   * When        | Who | What
   * ----------------------------------
   * 31-OCT-2016 | RG  | Created
   * 06-DEC-2016 | RG  | This header comment updated
   *
   * Description   :
   *
   * This is a simple prototype implementation for the given task of gathering database stats
   * concurrently, in case you are not satisfied with the built-in concurrent stats option available since 11.2.0.x
   *
   * In 11.2, the CONCURRENT stats option creates as many jobs as there are objects to gather
   * And the JOB_QUEUE_PROCESSES parameter then controls the number of concurrent jobs running
   * Since the ordering of execution isn't really optimized, many of these concurrent jobs might attempt to gather stats on the same object in case it is (sub)partitioned
   * This can lead to significant contention on Library Cache level (due to exclusive Library Cache Locks required by DDL / DBMS_STATS)
   *
   * In 12.1 the CONCURRENT stats option was obviously completed rewritten and uses some more intelligent processing
   * by calculating if and yes how many jobs should run concurrently for what kind of objects (see for example the new DBA_OPTSTAT_OPERATION_TASKS view that exposes some of these details)
   * Still I've observed many occasions with this new implementation where lots of objects were deliberately gathered in the main session
   * one after the other which doesn't really make good use of available resources in case many objects need to be analyzed
   *
   * This implementation tries to work around these points by using a simple queue-based approach for true concurrent stats processing
   * combined with an attempt to distribute the tables to analyze across the different threads in a way that minimizes the contention on Library Cache level
   *
   * It needs to be installed / executed under a suitable account that has the privileges to create queues, types, packages, tables, jobs and job classes and gather stats on the whole database
   *
   * A sample user profile could look like this:

   create user conc_stats identified by conc_stats;

   grant create session, create table, create procedure, create type, create job, manage scheduler, analyze any, analyze any dictionary to conc_stats;

   grant execute on sys.dbms_aq to conc_stats;

   grant execute on sys.dbms_aqadm to conc_stats;

   grant select on sys.v_$parameter to conc_stats;

   alter user conc_stats default tablespace users;

   alter user conc_stats quota unlimited on users;

   * Parameters to be checked, depending on concurrency desired:
   *
   * job_queue_processes: Needs to be set high enough to accommodate for the concurrent stats threads spawned. By default this package spawns CPU_COUNT concurrent threads
   * parallel_max_servers: If a stats thread is supposed to use Parallel Execution (degree > 1) for gathering stats you'll need at least threads * degree Parallel Slaves configured
   * services: It's possible to specify a service to have the stats threads only executed on RAC nodes that run that service
   *
   * The jobs are created under the same job class, currently hard coded value CONC_STATS - this makes the handling easier in case you want to stop / drop the jobs submitted manually
   *
   * The job class name can be passed to calls to DBMS_SCHEDULER.DROP_JOB or STOP_JOB - remember that job classes are owned by SYS, so you have to specify SYS.CONC_STATS for the job class name used here
   *
   * The main entry point STATS_CONCURRENT is all you need to call to start concurrent stats gathering on the database
   * similar to GATHER_DATABASE_STATS using one of the options GATHER, GATHER STALE or GATHER AUTO (default) - here you have to use LIST EMPTY, LIST STALE or LIST AUTO (default)
   *
   * The default behaviour when not specifying any parameters is to start as many threads as there are CPUs by using the CPU_COUNT parameter
   * If you want this to be multiplied by the number of instances in a RAC cluster uncomment the CLUSTER_DATABASE_INSTANCES reference below in the code (assuming same CPU_COUNT on all nodes)
   *
   * This also means that the "intra" parallelism per gather_table_stats call will be one in such a case since the intra parallelism is calculated by default as CPU_COUNT / number of threads
   *
   * If you don't want to have that many threads / PX slaves started, specify the number of concurrent threads and an intra-operation DOP explicitly when calling STATS_CONCURRENT
   *
   * If you want to replace the default nightly stats job with this here, the following steps should achieve this:

   BEGIN DBMS_AUTO_TASK_ADMIN.disable(
     client_name => 'auto optimizer stats collection',
     operation   => NULL,
     window_name => NULL);
   END;

   BEGIN DBMS_SCHEDULER.CREATE_JOB(
     job_name => '',
     schedule_name => 'MAINTENANCE_WINDOW_GROUP',
     job_type => 'PLSQL_BLOCK',
     job_action => 'begin pk_stats_concurrent.stats_concurrent(); end;',
     comments => 'auto optimizer stats collection replacement using concurrent stats operations based on AQ'
     enabled => true);
   END;

   * Please ensure the job is submitted under the account it's supposed to be run - using a different account like SYS to submit the job for a different schema
   * seems to cause problems with privileges (insufficient privileges error messages), at least this was reported to me
   *
   * The code at present only processes objects of type TABLE returned by GATHER_DATABASE_STATS but not indexes
   * assuming that these should be covered by the CASCADE functionality
   *
   * Note: This script is a prototype and comes with NO warranty. Use at your own risk and test/adjust in your environment as necessary
   *       before using it in any production-like case
   *
   * @headcom
   **/

  -- The queue name to use for AQ operations
  G_QUEUE_NAME               constant varchar2(24) := 'STATS_QUEUE';

  /**
   * Rudimentary logging required by the parallel threads since the
   * serveroutput generated can not be accessed
   * @param p_sql The SQL to log that raised the error
   * @param p_error_msg The error message to log
   **/
  procedure log(
    p_sql in clob
  , p_msg in clob
  )
  as
    -- We do this in an autonomous transaction since we want the logging
    -- to be visible while any other main transactions might be still going on
    pragma autonomous_transaction;
  begin
    insert into stats_concurrent_log(
      log_timestamp
    , sql_statement
    , message
    ) values (
      systimestamp
    , p_sql
    , p_msg
    );
    commit;
  end log;

  /**
   * Execute a SQL statement potentially in a different schema (dummy implementation here).
   * The string will be put to serveroutput before being executed
   * @param p_owner The schema to execute
   * @param p_sql The SQL to execute
   * @param p_log_error Should an error be logged or not. Default is true
   **/
  procedure execute(
    p_owner     in oracle_object
  , p_sql       in clob
  , p_log_error in boolean default true
  )
  as
  begin
    -- dbms_output.put_line('Owner: ' || p_owner || ' SQL: ' || substr(p_sql, 1, 4000));
  $if dbms_db_version.ver_le_10 $then
    declare
      a_sql           dbms_sql.varchar2a;
      n_start_line    number;
      n_end_line      number;
      c               integer;
      n               integer;
      LF constant     varchar2(10) := '
';
      len_LF constant integer := length(LF);
    begin
      n_start_line := 1 - len_LF;
      loop
        n_end_line := instr(p_sql, LF, n_start_line + len_LF);
        a_sql(a_sql.count + 1) := substr(p_sql, n_start_line + len_LF, case when n_end_line = 0 then length(p_sql) else n_end_line end - (n_start_line + len_LF) + len_LF);
        -- dbms_output.put_line(a_sql.count || ':' || a_sql(a_sql.count));
        exit when n_end_line = 0;
        n_start_line := n_end_line;
      end loop;
      c := dbms_sql.open_cursor;
      dbms_sql.parse(c, a_sql, 1, a_sql.count, false, dbms_sql.NATIVE);
      n := dbms_sql.execute(c);
      dbms_sql.close_cursor(c);
    end;
  $elsif dbms_db_version.ver_le_11 $then
    execute immediate p_sql;
  $else
    execute immediate p_sql;
  $end
  exception
  when others then
    dbms_output.put_line('Error: ' || SQLERRM);
    if p_log_error then
      log(p_sql, SQLERRM);
    end if;
    raise;
  end execute;

  /**
   * Execute a SQL statement potentially in a different schema (dummy implementation here).
   * This one uses an autonomous transaction.
   * The string will be put to serveroutput before being executed
   * @param p_owner The schema to execute
   * @param p_sql The SQL to execute
   * @param p_log_error Should an error be logged or not. Default is true
   **/
  procedure execute_autonomous(
    p_owner     in oracle_object
  , p_sql       in clob
  , p_log_error in boolean default true
  )
  as
    pragma autonomous_transaction;
  begin
    execute(p_owner, p_sql, p_log_error);
  end execute_autonomous;

  /**
   * Setup the AQ infrastructure (Queue tables, Queues)
   **/
  procedure setup_aq
  as
  begin
    begin
      execute(
        null
      , 'begin dbms_aqadm.create_queue_table(
           queue_table => ''' || G_QUEUE_NAME || '''
         , queue_payload_type => ''stats_concurrent_info''
         ); end;'
      );
    exception
    when others then
      dbms_output.put_line('Error creating Queue table: ' || SQLERRM);
      raise;
    end;

    begin
      execute(
        null
      , 'begin dbms_aqadm.create_queue(
           queue_name => ''' || G_QUEUE_NAME || '''
         , queue_table => ''' || G_QUEUE_NAME || '''
         ); end;'
      );
    exception
    when others then
      dbms_output.put_line('Error creating Queue: ' || SQLERRM);
      raise;
    end;

    begin
      execute(
        null
      , 'begin dbms_aqadm.start_queue(
           queue_name => ''' || G_QUEUE_NAME || '''
         ); end;'
      );
    exception
    when others then
      dbms_output.put_line('Error starting Queue: ' || SQLERRM);
      raise;
    end;
  end setup_aq;

  /**
   * Teardown the AQ infrastructure (Queue tables, Queues)
   **/
  procedure teardown_aq
  as
  begin
    begin
      execute(
        null
      , 'begin dbms_aqadm.stop_queue(
           queue_name => ''' || G_QUEUE_NAME || '''
         , wait       => true
         ); end;'
      , false
      );
    exception
    when others then
      dbms_output.put_line('Error stopping Queue: ' || SQLERRM);
      -- raise;
    end;

    begin
      execute(
        null
      , 'begin dbms_aqadm.drop_queue(
           queue_name => ''' || G_QUEUE_NAME || '''
         ); end;'
      , false
      );
    exception
    when others then
      dbms_output.put_line('Error dropping Queue: ' || SQLERRM);
      -- raise;
    end;

    begin
      execute(
        null
      , 'begin dbms_aqadm.drop_queue_table(
           queue_table => ''' || G_QUEUE_NAME || '''
         , force => true
         ); end;'
      , false
      );
    exception
    when others then
      dbms_output.put_line('Error dropping Queue table: ' || SQLERRM);
      -- raise;
    end;

  end teardown_aq;

  /**
   * Helper function to populate the AQ queue with data to process
   * @param p_gather_option What to pass to GATHER_DATABASE_STATS as option, default LIST AUTO
   **/
  function list_stale_database_stats (
    p_gather_option    in  varchar2 default 'LIST AUTO'
  )
  return dbms_stats.objecttab pipelined
  as
    pragma autonomous_transaction;
    m_object_list   dbms_stats.objecttab;
  begin
    if p_gather_option not in (
        'LIST AUTO', 'LIST STALE','LIST EMPTY'
    ) then
        null;
      else
        dbms_stats.gather_database_stats(
            options     => p_gather_option,
            objlist     => m_object_list
        );
        for i in 1..m_object_list.count loop
          pipe row (m_object_list(i));
        end loop;
    end if;
    return;
  end list_stale_database_stats;

  /**
   * Populate the AQ queue with data to process
   * @param p_parallel_degree The number threads to use - will be used for proper data preparation / queueing order
   * @param p_intra_degree The DOP to use per stats operation, by default calculate DOP based on CPU_COUNT and number of threads to run concurrently
   * @param p_gather_option What to pass to GATHER_DATABASE_STATS as option, default LIST AUTO
   **/
  procedure populate_queue(
    p_parallel_degree in integer
  , p_intra_degree    in integer default null
  , p_gather_option   in varchar2 default 'LIST AUTO'
  )
  as
    enq_msgid     raw(16);
    payload       stats_concurrent_info := stats_concurrent_info(null, null, null, null, null);
    n_dop         integer;
  begin
    -- By default determine what intra-operation DOP to use depending on how many concurrent stats threads are supposed to run
    select nvl(p_intra_degree, ceil((select to_number(value) from v$parameter where name = 'cpu_count') / p_parallel_degree)) as dop
    into n_dop
    from dual;
    -- Populate the queue and use some "intelligent" ordering attempting to minimize (library cache) contention on the objects
    for rec in (
      with
      -- The baseline, all TABLE objects returned by GATHER_DATABASE_STATS LIST* call
      a as (
      select /*+ materialize */ rownum as rn, a.* from table(pk_stats_concurrent.list_stale_database_stats(p_gather_option)) a where objtype = 'TABLE'
      ),
      -- Assign all table, partitions and subpartitions to p_parallel_degree buckets
      concurrent_stats as (
      select ntile(p_parallel_degree) over (order by rn) as new_order, a.* from a where partname is null
      union all
      select ntile(p_parallel_degree) over (order by rn) as new_order, a.* from a where partname is not null and subpartname is null
      union all
      select ntile(p_parallel_degree) over (order by rn) as new_order, a.* from a where partname is not null and subpartname is not null
      ),
      -- Now assign a row number within each bucket
      b as (
      select c.*, row_number() over (partition by new_order order by rn) as new_rn from concurrent_stats c
      )
      -- And pick one from each bucket in turn for queuing order
      select
              ownname
            , objname as tabname
            , coalesce(subpartname, partname) as partname
            , n_dop as degree
            , case when partname is null then 'GLOBAL' when partname is not null and subpartname is null then 'PARTITION' else 'SUBPARTITION' end as granularity
      from
              b
      order by
              new_rn, new_order
    ) loop
      payload.ownname     := rec.ownname;
      payload.tabname     := rec.tabname;
      payload.partname    := rec.partname;
      payload.degree      := rec.degree;
      payload.granularity := rec.granularity;
      -- TODO: Enqueue via array using ENQUEUE_ARRAY
      execute immediate '
      declare
        eopt          dbms_aq.enqueue_options_t;
        mprop         dbms_aq.message_properties_t;
      begin
        dbms_aq.enqueue(
            queue_name => ''' || G_QUEUE_NAME || ''',
            enqueue_options => eopt,
            message_properties => mprop,
            payload => :payload,
            msgid => :enq_msgid);
      end;'
      using payload, out enq_msgid;
    end loop;
    commit;
  end populate_queue;

  /**
   * This gets called for every stats thread
   * It pulls the object to gather from the AQ queue
   * @param p_optional_init Optionally a SQL can be passed usually used to initialize the session
            for example forcing a particular parallel degree
   **/
  procedure stats_thread(
    p_optional_init         in varchar2 default null
  )
  as
    deq_msgid             RAW(16);
    payload               stats_concurrent_info;
    no_messages           exception;
    pragma exception_init(no_messages, -25228);
    s_sql                 clob;
  begin
    if p_optional_init is not null then
      execute(null, p_optional_init);
    end if;

    -- If the VISIBILITY is set to IMMEDIATE
    -- it will cause the "queue transaction" to be committed
    -- Which means that the STOP_QUEUE call with the WAIT option will
    -- be able to stop the queue while the processing takes place
    -- and the queue table can be monitored for progress
    loop
      begin
        execute immediate '
        declare
          dopt                  dbms_aq.dequeue_options_t;
          mprop                 dbms_aq.message_properties_t;
        begin
          dopt.visibility := dbms_aq.IMMEDIATE;
          dopt.wait := dbms_aq.NO_WAIT;
          dbms_aq.dequeue(
              queue_name => ''' || G_QUEUE_NAME || ''',
              dequeue_options => dopt,
              message_properties => mprop,
              payload => :payload,
              msgid => :deq_msgid);
        end;'
        using out payload, out deq_msgid;
        s_sql := '
begin
  dbms_stats.gather_table_stats(
    ownname     => ''' || payload.ownname     || '''
  , tabname     => ''' || payload.tabname     || '''
  , partname    => ''' || payload.partname    || '''
  , degree      => ' || payload.degree      || '
  , granularity => ''' || payload.granularity || '''
  );
end;
';
        -- Execute the command
        log(s_sql, 'Ownname: ' || payload.ownname || ' Tabname: ' || payload.tabname || ' Partname: ' || payload.partname || ' Degree: ' || payload.degree || ' Granularity: ' || payload.granularity);
        begin
          execute_autonomous(payload.ownname, s_sql);
        exception
        /*
        when object_already_exists then
          null;
        when object_does_not_exist then
          null;
        */
        when others then
          null;
        end;
      exception
      when no_messages then
        exit;
      end;
    end loop;
    commit;
  end stats_thread;

  /**
   * The main entry point to gather statistics via parallel threads / AQ
   * @param p_parallel_degree The number of threads to start G_AUTO_PARALLEL_DEGREE means use the CPU_COUNT (but not
            CLUSTER_DATABASE_INSTANCES parameter, commented out below) to determine number of threads automatically
   * @param p_intra_degree The DOP to use per stats operation, by default calculate DOP based on CPU_COUNT and number of threads to run concurrently
   * @param p_service Specify a service if you want the jobs to be assigned to that particular service, default NULL
   * @param p_gather_option What to pass to GATHER_DATABASE_STATS as option, default LIST AUTO
   * @param p_optional_init Optionally a SQL can be passed usually used to initialize the session
            for example forcing a particular parallel degree
   **/
  procedure stats_concurrent(
    p_parallel_degree in integer  default G_AUTO_PARALLEL_DEGREE
  , p_intra_degree    in integer  default null
  , p_service         in varchar2 default null
  , p_gather_option   in varchar2 default 'LIST AUTO'
  , p_optional_init   in varchar2 default null
  )
  as
    n_cpu_count          binary_integer;
    n_instance_count     binary_integer;
    n_thread_count       binary_integer;
    strval               varchar2(256);
    partyp               binary_integer;
    e_job_class_exists exception;
    pragma exception_init(e_job_class_exists, -27477);
    s_job_class constant varchar2(30) := 'CONC_STATS';
  begin
    -- Truncate the log table
    execute immediate 'truncate table stats_concurrent_log';
    -- Just in case something has been left over from a previous run
    teardown_aq;
    setup_aq;
    -- Populate the queue
    populate_queue(p_parallel_degree, p_intra_degree, p_gather_option);
    -- Determine auto degree of parallelism
    partyp := dbms_utility.get_parameter_value('cpu_count', n_cpu_count, strval);
    partyp := dbms_utility.get_parameter_value('cluster_database_instances', n_instance_count, strval);
    n_thread_count := nvl(p_parallel_degree, n_cpu_count/* * n_instance_count*/);
    -- Create/use a common job class, makes job handling easier and allows binding to a specific service
    begin
      dbms_scheduler.create_job_class(s_job_class);
    exception
    when e_job_class_exists then
      null;
    end;
    -- Assign jobs to a particular service if requested
    if p_service is null then
      dbms_scheduler.set_attribute_null('SYS.' || s_job_class, 'SERVICE');
    else
      dbms_scheduler.set_attribute('SYS.' || s_job_class, 'SERVICE', p_service);
    end if;
    -- Submit the jobs
    for i in 1..n_thread_count loop
      dbms_scheduler.create_job(
        job_name   => s_job_class || '_' || i
      , job_type   => 'PLSQL_BLOCK'
      , job_class  => s_job_class
      , enabled    => true
      , job_action => 'begin dbms_session.set_role(''ALL''); pk_stats_concurrent.stats_thread(''' || p_optional_init || '''); end;'
      );
    end loop;
    -- Just in case anyone wants to use DBMS_JOB instead we need to commit the DBMS_JOB.SUBMIT
    commit;
    --execute immediate 'begin dbms_lock.sleep(:p_sleep_seconds); end;' using p_sleep_seconds;
    --teardown_aq;
  end stats_concurrent;
end pk_stats_concurrent;
/

show errors

spool off

Wednesday, November 2, 2016

"Cost Based Optimizer: Grundlagen – mit Update für Oracle 12c" Artikel (German)

Seit gestern steht auf der "Informatik Aktuell"-Seite mein Artikel "Cost Based Optimizer: Grundlagen – mit Update für Oracle 12c" zur Verfügung.

Er stimmt auch inhaltlich auf meinen Vortrag bei den IT-Tagen 2016 am 13. Dezember ein.

Sollte Sie das Thema interessieren, lade ich Sie hiermit also herzlich zu meinem Vortrag ein, bei dem ich das Thema auch mit Live-Demonstrationen vertiefen werde.

Sunday, August 21, 2016

Adaptive Cursor Sharing Fail

Here is another example (besides the fact that Adaptive Cursor Sharing only gets evaluated during a PARSE call (still valid in 12c) and supports a maximum of 14 bind variables) I've recently come across at a client site where the default implementation of Adaptive Cursor Sharing fails to create a more suitable execution plan for different bind variable values.

Broken down to a bare minimum the query was sometimes executed using non-existing values for a particular bind variable, but other times these values were existing and very popular. There were two suitable candidate indexes and one of them appeared to the optimizer more attractive in case of the "non-existing" value case. Unfortunately this index was a very bad choice for the "existing and very popular" case.

The critical point of the case is that due to other, additional filters on the same table/index the final number of rows produced by the row source operation was (almost) the same for the "non-existing" and the "existing and very popular" case, but in the latter case a large proportion of the bad index had to be scanned due to the popularity of the bind value, which was the only predicate that could be used as ACCESS predicate and the additional ones could only be applied as FILTER on the index.

So although there was a suitable histogram available on the column in question and the optimizer in principle was aware of the different popularities of values and marked the cursor as "bind sensitive" it looks like when a cursor is then monitored it just is assigned to different buckets as exposed via V$SQL_CS_HISTOGRAM, based on the rows produced by the row source. Since the operation in question didn't differ much in the final number of rows produced between the two cases (either 0 rows or 1 row) the different executions were all assigned to the same bucket - although the amount of work required to produce this single row was huge, reflected in execution time and physical / logical I/Os performed per execution.

Obviously this vastly different amount of work performed to produce a similar number of rows is not used as criteria for marking a cursor as "bind aware" and evaluate different execution plans based on ranges of bind values.

There is a view V$SQL_CS_STATISTICS that includes information about CPU_TIME and BUFFER_GETS but in 11.2.0.4 it only reflects the initial execution when starting with the "non-existing" value case, but not the slow executions afterwards. In 12.1.0.2 the view is no longer populated at all, which suggests that this information is simply not used for deciding the "bind aware" status of a cursor.

Discussing the case with Mohamed Houri, who has spent significant time on investigating the "Adaptive Cursor Sharing" feature seemed to confirm this assumption.

Here is a simple test case that allows reproducing the issue:
-- FILTER1 is highly skewed (here one very popular value -1)
create table t
as
select
        rownum as id
      , rownum as n
      , case when rownum <= 100000 then rownum else -1 end as filter1
      , rownum as filter2
      , rpad('x', 200) as filler1
      , rownum as filter3
      , rpad('x', 200) as filler2
from
        dual
connect by level <= 1e6;

-- Histogram on FILTER1 should make the sample query "bind sensitive"
exec dbms_stats.gather_table_stats(null, 't', method_opt => 'for all columns size 1 for columns size 254 filter1')

-- The "good" index, ACCESS on all three columns
-- But higher BLEVEL (3) due to FILLER1 only one value and wide - needs to be part of every branch block
create index t_idx1 on t (filter1, filler1, filter2) compress 2 /*advanced low*/;

-- The "bad" index, ACCESS only on first column, FILTER on subsequent columns
-- But lower BLEVEL (2) due to FILTER3 before FILLER1, leads to much more compact branch blocks
create index t_idx2 on t (filter1, filter3, filler1, filler2, filter2) compress 1 /*advanced low*/;
The critical point is that the good index has a higher BLEVEL than the bad index. So in case a non-existing value for FILTER1 gets used the optimizer will favor the index with the lower BLEVEL, which is for that case the key cost component:
set echo on

-- Non-existing value
-- T_IDX2 gets preferred
explain plan for
select sum(n) from t where filter1 = -999999 and filler1 = rpad('x', 200) and filter2 = 999999;

select * from table(dbms_xplan.display);

-----------------------------------------------------------------------------------------------
| Id  | Operation                            | Name   | Rows  | Bytes | Cost (%CPU)| Time     |
-----------------------------------------------------------------------------------------------
|   0 | SELECT STATEMENT                     |        |     1 |   216 |     4   (0)| 00:00:01 |
|   1 |  SORT AGGREGATE                      |        |     1 |   216 |            |          |
|   2 |   TABLE ACCESS BY INDEX ROWID BATCHED| T      |     1 |   216 |     4   (0)| 00:00:01 |
|*  3 |    INDEX RANGE SCAN                  | T_IDX2 |     1 |       |     3   (0)| 00:00:01 |
-----------------------------------------------------------------------------------------------

Predicate Information (identified by operation id):
---------------------------------------------------

   3 - access("FILTER1"=(-999999) AND "FILLER1"='x

                                                                                         ' AND
              "FILTER2"=999999)
       filter("FILTER2"=999999 AND "FILLER1"='x

                                                                                      ')
                                                                                     
-- Non-existing value
-- T_IDX1 has a higher cost
explain plan for
select /*+ index(t t_idx1) */ sum(n) from t where filter1 = -999999 and filler1 = rpad('x', 200) and filter2 = 999999;

select * from table(dbms_xplan.display);

-----------------------------------------------------------------------------------------------
| Id  | Operation                            | Name   | Rows  | Bytes | Cost (%CPU)| Time     |
-----------------------------------------------------------------------------------------------
|   0 | SELECT STATEMENT                     |        |     1 |   216 |     5   (0)| 00:00:01 |
|   1 |  SORT AGGREGATE                      |        |     1 |   216 |            |          |
|   2 |   TABLE ACCESS BY INDEX ROWID BATCHED| T      |     1 |   216 |     5   (0)| 00:00:01 |
|*  3 |    INDEX RANGE SCAN                  | T_IDX1 |     1 |       |     4   (0)| 00:00:01 |
-----------------------------------------------------------------------------------------------

Predicate Information (identified by operation id):
---------------------------------------------------

   3 - access("FILTER1"=(-999999) AND "FILLER1"='x

                                                                                         ' AND
              "FILTER2"=999999)
              
-- Existing and very popular value
-- T_IDX1 gets preferred
explain plan for
select sum(n) from t where filter1 = -1 and filler1 = rpad('x', 200) and filter2 = 999999;

select * from table(dbms_xplan.display);

-----------------------------------------------------------------------------------------------
| Id  | Operation                            | Name   | Rows  | Bytes | Cost (%CPU)| Time     |
-----------------------------------------------------------------------------------------------
|   0 | SELECT STATEMENT                     |        |     1 |   216 |     5   (0)| 00:00:01 |
|   1 |  SORT AGGREGATE                      |        |     1 |   216 |            |          |
|   2 |   TABLE ACCESS BY INDEX ROWID BATCHED| T      |     1 |   216 |     5   (0)| 00:00:01 |
|*  3 |    INDEX RANGE SCAN                  | T_IDX1 |     1 |       |     4   (0)| 00:00:01 |
-----------------------------------------------------------------------------------------------

Predicate Information (identified by operation id):
---------------------------------------------------

   3 - access("FILTER1"=(-1) AND "FILLER1"='x

                                                                                    ' AND
              "FILTER2"=999999)


-- Existing and very popular value
-- T_IDX2 is a bad idea, correctly reflected in the cost estimate
explain plan for
select /*+ index(t t_idx2) */ sum(n) from t where filter1 = -1 and filler1 = rpad('x', 200) and filter2 = 999999;

select * from table(dbms_xplan.display);

-----------------------------------------------------------------------------------------------
| Id  | Operation                            | Name   | Rows  | Bytes | Cost (%CPU)| Time     |
-----------------------------------------------------------------------------------------------
|   0 | SELECT STATEMENT                     |        |     1 |   216 | 58269   (1)| 00:00:03 |
|   1 |  SORT AGGREGATE                      |        |     1 |   216 |            |          |
|   2 |   TABLE ACCESS BY INDEX ROWID BATCHED| T      |     1 |   216 | 58269   (1)| 00:00:03 |
|*  3 |    INDEX RANGE SCAN                  | T_IDX2 |     1 |       | 58268   (1)| 00:00:03 |
-----------------------------------------------------------------------------------------------

Predicate Information (identified by operation id):
---------------------------------------------------

   3 - access("FILTER1"=(-1) AND "FILLER1"='x

                                                                                    ' AND
              "FILTER2"=999999)
       filter("FILTER2"=999999 AND "FILLER1"='x

                                                                                      ')
So when optimizing for the two different cases the optimizer does the right thing and understands that for the case "existing and very popular" T_IDX2 is a bad choice. It's also obvious from the "Predicate Information" section that the index T_IDX2 only can use FILTER1 as ACCESS predicate.

But when using bind variables the different cases are not recognized and the bad index is used for both cases when the optimization is based on the "non-existing value" case:
-- Default behaviour, although being BIND_SENSITIVE thanks to the histogram, no ACS kicks in
-- The V$SQL_CS_HISTOGRAM shows all executions being in bucket 0, so according to BIND_SENSITIVE monitoring no need for action
set echo on timing on time on

alter session set statistics_level = all;

variable n number

exec :n := -999999

declare
  res number;
begin
  select sum(n) into res from t where filter1 = :n and filler1 = rpad('x', 200) and filter2 = 999999;
end;
/

exec :n := -1

declare
  res number;
begin
  for i in 1..1000 loop
    select sum(n) into res from t where filter1 = :n and filler1 = rpad('x', 200) and filter2 = 999999;
  end loop;
end;
/

SQL> alter session set statistics_level = all;

Session altered.

Elapsed: 00:00:00.03
SQL>
SQL> variable n number
SQL>
SQL> exec :n := -999999

PL/SQL procedure successfully completed.

Elapsed: 00:00:00.03
SQL>
SQL> declare
  2    res number;
  3  begin
  4    select sum(n) into res from t where filter1 = :n and filler1 = rpad('x', 200) and filter2 = 999999;
  5  end;
  6  /

PL/SQL procedure successfully completed.

Elapsed: 00:00:00.28
SQL>
SQL> exec :n := -1

PL/SQL procedure successfully completed.

Elapsed: 00:00:00.04
SQL>
SQL> declare
  2    res number;
  3  begin
  4    for i in 1..1000 loop
  5      select sum(n) into res from t where filter1 = :n and filler1 = rpad('x', 200) and filter2 = 999999;
  6    end loop;
  7  end;
  8  /

PL/SQL procedure successfully completed.

Elapsed: 00:04:48.64
SQL>

-- With BIND_AWARE a second child cursors gets generated and used on second parse, interesting
set echo on timing on time on

alter session set statistics_level = all;

variable n number

exec :n := -999999

declare
  res number;
begin
  select /*+ bind_aware */ sum(n) into res from t where filter1 = :n and filler1 = rpad('x', 200) and filter2 = 999999;
end;
/

exec :n := -1

declare
  res number;
begin
  for i in 1..1000 loop
    select /*+ bind_aware */ sum(n) into res from t where filter1 = :n and filler1 = rpad('x', 200) and filter2 = 999999;
  end loop;
end;
/

SQL> alter session set statistics_level = all;

Session altered.

Elapsed: 00:00:00.03
SQL>
SQL> variable n number
SQL>
SQL> exec :n := -999999

PL/SQL procedure successfully completed.

Elapsed: 00:00:00.03
SQL>
SQL> declare
  2    res number;
  3  begin
  4    select /*+ bind_aware */ sum(n) into res from t where filter1 = :n and filler1 = rpad('x', 200) and filter2 = 999999;
  5  end;
  6  /

PL/SQL procedure successfully completed.

Elapsed: 00:00:00.04
SQL>
SQL> exec :n := -1

PL/SQL procedure successfully completed.

Elapsed: 00:00:00.03
SQL>
SQL> declare
  2    res number;
  3  begin
  4    for i in 1..1000 loop
  5      select /*+ bind_aware */ sum(n) into res from t where filter1 = :n and filler1 = rpad('x', 200) and filter2 = 999999;
  6    end loop;
  7  end;
  8  /

PL/SQL procedure successfully completed.

Elapsed: 00:00:00.20
SQL>

-- Or hinting for a fixed plan helps, too
set echo on timing on time on

alter session set statistics_level = all;

variable n number

exec :n := -999999

declare
  res number;
begin
  select /*+ index(t t_idx1) */ sum(n) into res from t where filter1 = :n and filler1 = rpad('x', 200) and filter2 = 999999;
end;
/

exec :n := -1

declare
  res number;
begin
  for i in 1..1000 loop
    select /*+ index(t t_idx1) */ sum(n) into res from t where filter1 = :n and filler1 = rpad('x', 200) and filter2 = 999999;
  end loop;
end;
/
Executing the unhinted, default case leads to a very inefficient execution of the thousand executions using the popular value (and the actual table / index at the client site was much larger than this example and the query got executed very frequently) - compare that to the execution time for the other two variants, either using the BIND_AWARE hint or simply requesting the good index.

So when requesting to mark the cursor immediately BIND_AWARE via the corresponding hint (only possible if the cursor qualifies to be bind sensitive) Oracle happily generates a second child cursor at the second PARSE call with a different, more efficient execution plan for the popular value, because when a cursor is marked bind aware a completely different algorithm gets used that is based on range of values as exposed via V$SQL_CS_SELECTIVITY, and since the different values are falling into different ranges of values a new plan gets generated that is different from the previous one and hence gets used from then on for those (range of) values.

Monday, August 15, 2016

Nested Loop Join Physical I/O Optimizations

Having done my mini-series on Nested Loop join logical I/O optimizations a while ago I unfortunately never managed to publish anything regarding the Nested Loop join physical I/O optimizations, which are certainly much more relevant to real-life performance.

Therefore the main purpose of this blog post is to point you to Nikolay Savvinov's (whose blog I can recommend in general) great mini-series covering various aspects of these optimizations:

Part 1
Part 2
Part 3
Summary

One point that - at least to me - isn't entirely clear when reading Nikolay's series is which specific plan shape he refers to, in particular since in 12c even more plan shapes for a Nested Loop join are possible.

Hence here is an attempt to summarize the various two table Nested Loop join plan shapes as of 12c and what kind of physical I/O optimizations one can expect from them:

1. Nested Loop Join Batching, the default in most cases since 11g and also in 12c
-----------------------------------------------------------
| Id  | Operation                     | Name              |
-----------------------------------------------------------
|   0 | SELECT STATEMENT              |                   |
|   1 |  SORT AGGREGATE               |                   |
|   2 |   NESTED LOOPS                |                   |
|   3 |    NESTED LOOPS               |                   |
|   4 |     INDEX FULL SCAN           | SYS_IOT_TOP_97632 |
|*  5 |     INDEX RANGE SCAN          | T_I6_IDX          |
|   6 |    TABLE ACCESS BY INDEX ROWID| T_I6              |
-----------------------------------------------------------
This is the plan shape that Nikolay calls "batch" or "batching" in his posts. It can provide batched I/O (mainly "db file parallel read" issuing multiple I/O requests in a single call, potentially asynchronous I/O) on both the INDEX RANGE SCAN as well as the TABLE ACCESS BY ROWID operation as described in Nikolay's blog post.

Please note that I deliberately write "can provide batched I/O", because, as Nikolay also points out in his posts, the runtime engine monitors the execution and can dynamically adjust the behaviour, which also means that it might decide to use conventional single block reads ("db file sequential read").

Please also note that in addition to the "db file parallel read" operation that submits multiple I/O requests in a single I/O submit call (see Frits Hoogland's blog post from some time ago about Linux internals of this I/O operation) the runtime engine might use "db file scattered read" multi-block I/Os under certain circumstances, in particular when performing "cache warmup prefetching".

Also note that as Nikolay points out when enabling SQL Trace or "rowsource statistics" the "Batched I/O" optimization for some reason gets disabled.

Also this plan shape at least in 12c seems to lead to inconsistencies in the Real-Time SQL Monitoring in several ways. First the number of "Executions" for the INDEX RANGE SCAN and TABLE ACCESS component of the inner row source is not necessarily consistent with the number of rows in the driving row source, second almost all activity and I/O volume seems to be contributed to the "INDEX RANGE SCAN" plan operation and not the "TABLE ACCESS" operation, even if it's the "TABLE ACCESS" that causes physical I/O.

2. Nested Loop Join Prefetch plan shape including BATCHED ROWID table access (only from 12c on)
------------------------------------------------------------------
| Id  | Operation                            | Name              |
------------------------------------------------------------------
|   0 | SELECT STATEMENT                     |                   |
|   1 |  SORT AGGREGATE                      |                   |
|   2 |   TABLE ACCESS BY INDEX ROWID BATCHED| T_I5              |
|   3 |    NESTED LOOPS                      |                   |
|   4 |     INDEX FULL SCAN                  | SYS_IOT_TOP_97716 |
|*  5 |     INDEX RANGE SCAN                 | T_I5_IDX          |
------------------------------------------------------------------
This is the Nested Loop prefetching plan shape introduced in Oracle 9i combined with the new TABLE ACCESS BY INDEX ROWID BATCHED introduced in 12c. It's the plan shape Nikolay refers to with "BATCHED ROWID" in his posts. In my (and Nikolay's) tests this provides the most aggressive batching of I/O (highest number of I/O requests submitted per call in "db file parallel read") for the TABLE ACCESS BY ROWID BATCHED, but didn't perform the same on the index ("db file sequential read", single block reads on the index segment), which doesn't mean that different test and data setups might provide that, too.
Note you should get this plan shape only with explicit hinting or disabling Nested Loop Join Batching via parameter.

In 12c, given a two table join between alias A and B, the following hints would be required to arrive at this plan shape:
leading(a b)
use_nl(b)
index(b)
no_nlj_batching(b)
--batch_table_access_by_rowid(b)
The "batch_table_access_by_rowid" isn't strictly necessary since it's the default behaviour in 12c.

Other variants are possible, like "use_nl_with_index" instead of "use_nl" and "index" separately or "opt_param('_nlj_batching_enabled', 0)" instead of "no_nlj_batching" to disable the batching (but then batching is disabled for the whole execution plan, not just for a particular join).

3. Classic Nested Loop Join Prefetch introduced in 9i
----------------------------------------------------------
| Id  | Operation                    | Name              |
----------------------------------------------------------
|   0 | SELECT STATEMENT             |                   |
|   1 |  SORT AGGREGATE              |                   |
|   2 |   TABLE ACCESS BY INDEX ROWID| T_I5              |
|   3 |    NESTED LOOPS              |                   |
|   4 |     INDEX FULL SCAN          | SYS_IOT_TOP_97716 |
|*  5 |     INDEX RANGE SCAN         | T_I5_IDX          |
----------------------------------------------------------
This is what you get in pre-12c when preventing Nested Loop Join Batching, in 12c the BATCHED table access needs to be disabled in addition.

This plan shape provides the less aggressive table prefetching as described in Nikolay's posts (he refers to this plan shape as "Prefetch"), maximum number of requests submitted per call in a "db file parallel read" operation seems to 39.

As mentioned above, it didn't provide index prefetching in my tests.

The session statistics don't mention "Batched I/O", so although the "db file parallel read" wait event is the same the internal implementation obviously is a different code path.

In 12c, given a two table join between alias A and B, the following hints would be required to arrive at this plan shape:
leading(a b)
use_nl(b)
index(b)
no_nlj_batching(b)
no_batch_table_access_by_rowid(b)
Other variants as above.

4. Classic Nested Loop Join plan shape with BATCHED ROWID table access (only from 12c on)
-------------------------------------------------------------------
| Id  | Operation                             | Name              |
-------------------------------------------------------------------
|   0 | SELECT STATEMENT                      |                   |
|   1 |  SORT AGGREGATE                       |                   |
|   2 |   NESTED LOOPS                        |                   |
|   3 |    INDEX FULL SCAN                    | SYS_IOT_TOP_97716 |
|   4 |    TABLE ACCESS BY INDEX ROWID BATCHED| T_I5              |
|*  5 |     INDEX RANGE SCAN                  | T_I5_IDX          |
-------------------------------------------------------------------
This is the classic Nested Loop join plan shape (pre-9i) combined with the new TABLE ACCESS BY INDEX ROWID BATCHED introduced in 12c.

In my tests it provides only "intra-loop" table prefetching, so if the INDEX RANGE SCAN of a single loop iteration points to different table blocks the TABLE ACCESS BY INDEX ROWID BATCHED can make use of "db file parallel read" to batch these I/O requests to the table blocks, and the session statistics show "Batched I/O" counters increasing.

However, it doesn't attempt to optimize "inter-loop" / multiple loop iterations, so if each loop iteration via the INDEX RANGE SCAN only points to a single table block, only single block reads ("db file sequential read") on the TABLE ACCESS BY INDEX ROWID BATCHED can be seen.

In my tests this plan shape didn't provide index prefetching / I/O optimizations and performed single block reads ("db file sequential read") on the INDEX RANGE SCAN operation.

For a two table join it needs explicit hinting in 12c to arrive at this plan shape, but it is the default plan shape for the "inner" joins in case of nested Nested Loop joins (multiple, consecutive Nested Loop joins in a row), see below for more information.

In 12c, given a two table join between alias A and B, the following hints would be required to arrive at this plan shape:
leading(a b)
use_nl(b)
index(b)
opt_param('_nlj_batching_enabled', 0)
no_nlj_prefetch(b)
--batch_table_access_by_rowid(b)
See my older posts regarding Nested Loop join logical I/O optimizations why the combination of OPT_PARAM nd NO_NLJ_PREFETCH is required to arrive at this plan shape - in short, specifying the obvious NO_NLJ_PREFETCH plus NO_NLJ_BATCHING doesn't work. Other variants as above.

5. Classic Nested Loop Join plan shape
-----------------------------------------------------------
| Id  | Operation                     | Name              |
-----------------------------------------------------------
|   0 | SELECT STATEMENT              |                   |
|   1 |  SORT AGGREGATE               |                   |
|   2 |   NESTED LOOPS                |                   |
|   3 |    INDEX FULL SCAN            | SYS_IOT_TOP_97716 |
|   4 |    TABLE ACCESS BY INDEX ROWID| T_I5              |
|*  5 |     INDEX RANGE SCAN          | T_I5_IDX          |
-----------------------------------------------------------
This is the classic Nested Loop join plan shape (pre-9i).

Interestingly in my tests at least in 12c it provides also "intra-loop" table prefetching, so if the INDEX RANGE SCAN of a single loop iteration points to different table blocks the TABLE ACCESS BY INDEX ROWID can make use of "db file parallel read" to submit multiple of these I/O requests to the table blocks in a single call, but the session statistics don't show "Batched I/O" counters increasing and the maximum number of requests seem to be 39, so it is less aggressive and looks very similar to the internal implementation used for the classic "table prefetching" plan shape above.

There is no sign of "inter-loop" optimizations and the INDEX RANGE SCAN seems to make use of single block reads only ("db file sequential read").

For pre-12c this is default plan shape used for the "inner" joins in case of nested Nested Loop joins (multiple Nested Loop joins in a row), see below for more information.

In 12c, given a two table join between alias A and B, the following hints would be required to arrive at this plan shape:
leading(a b)
use_nl(b)
index(b)
opt_param('_nlj_batching_enabled', 0)
no_nlj_prefetch(b)
no_batch_table_access_by_rowid(b)
Other variants as above.

Multiple, consecutive Nested Loop Joins


Another point that I think it is important to mention when describing these "inter-loop" prefetching and batching Nested Loop join optimization techniques is that they only apply to the "outer-most" Nested Loop join in case of multiple, consecutive Nested Loop joins, which makes their "game changing" character that Nikolay mentions in his posts less strong to me.

For example, this is the 12c default shape of a four table join using three Nested Loop joins:
----------------------------------------------------------------------
| Id  | Operation                                | Name              |
----------------------------------------------------------------------
|   0 | SELECT STATEMENT                         |                   |
|   1 |  SORT AGGREGATE                          |                   |
|   2 |   NESTED LOOPS                           |                   |
|   3 |    NESTED LOOPS                          |                   |
|   4 |     NESTED LOOPS                         |                   |
|   5 |      NESTED LOOPS                        |                   |
|   6 |       INDEX FULL SCAN                    | SYS_IOT_TOP_97632 |
|   7 |       TABLE ACCESS BY INDEX ROWID BATCHED| T_I1              |
|*  8 |        INDEX RANGE SCAN                  | T_I1_IDX          |
|   9 |      TABLE ACCESS BY INDEX ROWID BATCHED | T_I2              |
|* 10 |       INDEX RANGE SCAN                   | T_I2_IDX          |
|* 11 |     INDEX RANGE SCAN                     | T_I3_IDX          |
|  12 |    TABLE ACCESS BY INDEX ROWID           | T_I3              |
----------------------------------------------------------------------
As it can be seen only the outer-most Nested Loop joins gets the "batching" plan shape and can benefit from the optimizations described above. The inner Nested Loop joins show the classic plan shape, in case of 12c with the ROWID BATCHED option, so they can only benefit from the "intra-loop" optimizations described above, if a single loop iteration INDEX RANGE SCAN points to several table blocks.

Note that even when using explicit, additional NLJ_BATCHING hints for the inner tables joined I wasn't able to enforce any other plan shape.

If there are multiple blocks of (consecutive) Nested Loop joins (for example a HASH JOIN in between), then in each block the outer-most Nested Loop join gets the optimization, so multiple of those are possible per execution plan:
---------------------------------------------------------------------
| Id  | Operation                               | Name              |
---------------------------------------------------------------------
|   0 | SELECT STATEMENT                        |                   |
|   1 |  SORT AGGREGATE                         |                   |
|   2 |   NESTED LOOPS                          |                   |
|   3 |    NESTED LOOPS                         |                   |
|*  4 |     HASH JOIN                           |                   |
|   5 |      TABLE ACCESS BY INDEX ROWID BATCHED| T_I2              |
|   6 |       INDEX FULL SCAN                   | T_I2_IDX          |
|   7 |      NESTED LOOPS                       |                   |
|   8 |       NESTED LOOPS                      |                   |
|   9 |        INDEX FULL SCAN                  | SYS_IOT_TOP_97632 |
|* 10 |        INDEX RANGE SCAN                 | T_I1_IDX          |
|  11 |       TABLE ACCESS BY INDEX ROWID       | T_I1              |
|* 12 |     INDEX RANGE SCAN                    | T_I3_IDX          |
|  13 |    TABLE ACCESS BY INDEX ROWID          | T_I3              |
---------------------------------------------------------------------
As it can be seen now that T_I2 is joined via a HASH JOIN both Nested Loop joins to T_I1 and T_I3 get the "batched" optimization plan shape.

I don't know why this limitation is there that only the outer-most in a block of Nested Loop joins gets the optimized plan shape, but it certainly can reduce the possible benefit.

Since I don't think there is a costing difference on CBO level for the different Nested Loop join plan shapes (so the decision which shape to use isn't cost-driven) it might be possible to see a significant performance difference depending on which join gets the optimization - there might be room for improvement by manually influencing the join order in case of multiple, consecutive Nested Loop joins.

Sunday, July 10, 2016

Comparing Columns Containing NULL Values

Prompted by a (not really that) recent discussion on the OTN forum I've decided to publish this note.

Sometimes you have the task of comparing column values and handling the NULL value cases correctly makes this rather cumbersome for columns that are allowed to be NULL.

The "official" SQL way of comparing two column values and to find out whether they are equal or not - under the assumption that having NULL in both columns should be treated as equal (a point that can be argued) would read in SQL something like the following for the "unequal" case:
column1 != column2 or (column1 is null and column2 is not null) or (column1 is not null and column2 is null)
and
column1 = column2 or (column1 is null and column2 is null)
for the "equal" case.

Imagine this to be done for a lot of columns and it becomes obvious that people might be looking for more concise alternatives how to express this.

Sometimes you might have come across code that uses NVL or a similar function with some "special" value that is not supposed to be part of the column data to be compared - like -1 for (positive) integer values for example, but this has the inherent risk of producing wrong results if the "special" value is (or might become in future) not that special after all.

The not really documented SYS_OP_MAP_NONNULL function could come handy if it was official, because it covers the NULL cases automatically.

Note: I still would call it undocumented even if it shows up in some "Materialized View" related part of the official 12c documentation, because it is not part of the official SQL language manual
SYS_OP_MAP_NONNULL(column1) != SYS_OP_MAP_NONNULL(column2)
is all that is needed. More concise as above, but undocumented.

And: There is one obvious drawback to SYS_OP_MAP_NONNULL, since it adds one byte to the input value to ensure the mapped NULL value differs from any other value: It doesn't work properly with maxed out columns, for example this:
SQL> create table t
  2  as
  3  select rpad('x', 4000) as col1, rpad('x', 4000) as col2 from dual
  4  union all
  5  select rpad('x', 4000) as col1, rpad('y', 4000) as col2 from dual
  6  union all
  7  select null as col1, rpad('y', 4000) as col2 from dual
  8  union all
  9  select rpad('x', 4000) as col1, null from dual
 10  union all
 11  select null as col1, null as col2 from dual
 12  ;

Table created.

SQL>
SQL> exec dbms_stats.gather_table_stats(null, 't')

PL/SQL procedure successfully completed.

SQL>
SQL> select count(*) from t where sys_op_map_nonnull(col1) = sys_op_map_nonnull(col2);
select count(*) from t where sys_op_map_nonnull(col1) = sys_op_map_nonnull(col2)
                     *
ERROR at line 1:
ORA-01706: user function result value was too large
errors out with "ORA-01706: user function result value was too large".

DECODE


Decode is an exception to the rule how Oracle treats NULLs in SQL - it returns the "equal" value if both operands to compare are NULL, so it allows the following construct to achieve above comparison (see above OTN forum discussion for credits where this expression appeared first, more recently here on Stew Ashton's blog):

For checking for inequality:
decode(column1, column2, 0, 1) = 1
For equality:
decode(column1, column2, 0, 1) = 0
Very concise, and officially documented.

Interestingly, starting with 11.2.0.2 there is an implicit re-write by default enabled that rewrites above expression (and only this variation, not the one testing for inequality):
decode(column1, column2, 0, 1) = 0
into
sys_op_map_nonnull(column1) = sys_op_map_nonnull(column2)
This is controlled via fix control 8551880 ("Rewrite decode predicate to join").

Guess what happens when running the following query in 11.2.0.2 or later against above data set (the fix control is enabled by default in these versions):
SQL> select /*+ opt_param('_fix_control', '8551880:0') */ count(*) from t where decode(col1, col2, 0, 1) = 0;

  COUNT(*)
----------
         2

SQL>
SQL> select /*+ opt_param('_fix_control', '8551880:1') */ count(*) from t where decode(col1, col2, 0, 1) = 0;
select /*+ opt_param('_fix_control', '8551880:1') */ count(*) from t where decode(col1, col2, 0, 1) = 0
                                                                   *
ERROR at line 1:
ORA-01706: user function result value was too large
Finally, what about performance? For that purpose I created the following compressed 50M rows table, covering different cases:
create table t1 compress
as
select case mod(rownum, 5) + 1
       when 1 then cast('C1' as varchar2(20))
       when 2 then cast(null as varchar2(20))
       when 3 then cast('C3' as varchar2(20))
       when 4 then cast(null as varchar2(20))
       when 5 then cast('C5' as varchar2(20))
       end as col1,
       case mod(rownum, 5) + 1
       when 1 then cast('C2' as varchar2(20))
       when 2 then cast(null as varchar2(20))
       when 3 then cast('C3' as varchar2(20))
       when 4 then cast('C4' as varchar2(20))
       when 5 then cast(null as varchar2(20))
       end as col2
from
     (select /*+ cardinality(1e4) */ null from dual connect by level <= 1e4)
   , (select /*+ cardinality(5e3) */ null from dual connect by level <= 5e3)
;
and got the following results from 11.2.0.4 (ignoring the different cardinality estimates for the moment, since I'm only interested in the elapsed time here):
SQL> select count(*) from t1;

Elapsed: 00:00:00.94

Execution Plan
----------------------------------------------------------
Plan hash value: 3724264953

-------------------------------------------------------------------
| Id  | Operation          | Name | Rows  | Cost (%CPU)| Time     |
-------------------------------------------------------------------
|   0 | SELECT STATEMENT   |      |     1 | 18743   (2)| 00:03:45 |
|   1 |  SORT AGGREGATE    |      |     1 |            |          |
|   2 |   TABLE ACCESS FULL| T1   |    50M| 18743   (2)| 00:03:45 |
-------------------------------------------------------------------


Statistics
----------------------------------------------------------
          0  recursive calls
          0  db block gets
      68456  consistent gets
          0  physical reads
          0  redo size
        346  bytes sent via SQL*Net to client
        364  bytes received via SQL*Net from client
          2  SQL*Net roundtrips to/from client
          0  sorts (memory)
          0  sorts (disk)
          1  rows processed

SQL>
SQL> select count(*) from t1 where decode(col1, col2, 0, 1) = 1;

Elapsed: 00:00:02.55

Execution Plan
----------------------------------------------------------
Plan hash value: 3724264953

---------------------------------------------------------------------------
| Id  | Operation          | Name | Rows  | Bytes | Cost (%CPU)| Time     |
---------------------------------------------------------------------------
|   0 | SELECT STATEMENT   |      |     1 |     4 | 19176   (4)| 00:03:51 |
|   1 |  SORT AGGREGATE    |      |     1 |     4 |            |          |
|*  2 |   TABLE ACCESS FULL| T1   |   500K|  1953K| 19176   (4)| 00:03:51 |
---------------------------------------------------------------------------

Predicate Information (identified by operation id):
---------------------------------------------------

   2 - filter(DECODE("COL1","COL2",0,1)=1)


Statistics
----------------------------------------------------------
          0  recursive calls
          0  db block gets
      68456  consistent gets
          0  physical reads
          0  redo size
        346  bytes sent via SQL*Net to client
        364  bytes received via SQL*Net from client
          2  SQL*Net roundtrips to/from client
          0  sorts (memory)
          0  sorts (disk)
          1  rows processed

SQL>
SQL> select count(*) from t1 where SYS_OP_MAP_NONNULL("COL1")!=SYS_OP_MAP_NONNULL("COL2");

Elapsed: 00:00:03.04

Execution Plan
----------------------------------------------------------
Plan hash value: 3724264953

---------------------------------------------------------------------------
| Id  | Operation          | Name | Rows  | Bytes | Cost (%CPU)| Time     |
---------------------------------------------------------------------------
|   0 | SELECT STATEMENT   |      |     1 |     4 | 19515   (6)| 00:03:55 |
|   1 |  SORT AGGREGATE    |      |     1 |     4 |            |          |
|*  2 |   TABLE ACCESS FULL| T1   |    15M|    60M| 19515   (6)| 00:03:55 |
---------------------------------------------------------------------------

Predicate Information (identified by operation id):
---------------------------------------------------

   2 - filter(SYS_OP_MAP_NONNULL("COL1")<>SYS_OP_MAP_NONNULL("COL2"))


Statistics
----------------------------------------------------------
          0  recursive calls
          0  db block gets
      68456  consistent gets
          0  physical reads
          0  redo size
        346  bytes sent via SQL*Net to client
        364  bytes received via SQL*Net from client
          2  SQL*Net roundtrips to/from client
          0  sorts (memory)
          0  sorts (disk)
          1  rows processed

SQL>
SQL> select count(*) from t1 where (col1 != col2 or (col1 is null and col2 is not null) or (col1 is not null and col2 is null));

Elapsed: 00:00:03.51

Execution Plan
----------------------------------------------------------
Plan hash value: 3724264953

---------------------------------------------------------------------------
| Id  | Operation          | Name | Rows  | Bytes | Cost (%CPU)| Time     |
---------------------------------------------------------------------------
|   0 | SELECT STATEMENT   |      |     1 |     4 | 18876   (2)| 00:03:47 |
|   1 |  SORT AGGREGATE    |      |     1 |     4 |            |          |
|*  2 |   TABLE ACCESS FULL| T1   |    30M|   115M| 18876   (2)| 00:03:47 |
---------------------------------------------------------------------------

Predicate Information (identified by operation id):
---------------------------------------------------

   2 - filter("COL1" IS NULL AND "COL2" IS NOT NULL OR "COL2" IS NULL
              AND "COL1" IS NOT NULL OR "COL1"<>"COL2")


Statistics
----------------------------------------------------------
          1  recursive calls
          0  db block gets
      68456  consistent gets
          0  physical reads
          0  redo size
        346  bytes sent via SQL*Net to client
        364  bytes received via SQL*Net from client
          2  SQL*Net roundtrips to/from client
          0  sorts (memory)
          0  sorts (disk)
          1  rows processed

SQL>
SQL> select /*+ opt_param('_fix_control', '8551880:0') */ count(*) from t1 where decode(col1, col2, 0, 1) = 0;

Elapsed: 00:00:02.49

Execution Plan
----------------------------------------------------------
Plan hash value: 3724264953

---------------------------------------------------------------------------
| Id  | Operation          | Name | Rows  | Bytes | Cost (%CPU)| Time     |
---------------------------------------------------------------------------
|   0 | SELECT STATEMENT   |      |     1 |     4 | 19176   (4)| 00:03:51 |
|   1 |  SORT AGGREGATE    |      |     1 |     4 |            |          |
|*  2 |   TABLE ACCESS FULL| T1   |   500K|  1953K| 19176   (4)| 00:03:51 |
---------------------------------------------------------------------------

Predicate Information (identified by operation id):
---------------------------------------------------

   2 - filter(DECODE("COL1","COL2",0,1)=0)


Statistics
----------------------------------------------------------
          1  recursive calls
          0  db block gets
      68456  consistent gets
          0  physical reads
          0  redo size
        346  bytes sent via SQL*Net to client
        364  bytes received via SQL*Net from client
          2  SQL*Net roundtrips to/from client
          0  sorts (memory)
          0  sorts (disk)
          1  rows processed

SQL>
SQL> select /*+ opt_param('_fix_control', '8551880:1') */ count(*) from t1 where decode(col1, col2, 0, 1) = 0;

Elapsed: 00:00:03.04

Execution Plan
----------------------------------------------------------
Plan hash value: 3724264953

---------------------------------------------------------------------------
| Id  | Operation          | Name | Rows  | Bytes | Cost (%CPU)| Time     |
---------------------------------------------------------------------------
|   0 | SELECT STATEMENT   |      |     1 |     4 | 19515   (6)| 00:03:55 |
|   1 |  SORT AGGREGATE    |      |     1 |     4 |            |          |
|*  2 |   TABLE ACCESS FULL| T1   |  6000K|    22M| 19515   (6)| 00:03:55 |
---------------------------------------------------------------------------

Predicate Information (identified by operation id):
---------------------------------------------------

   2 - filter(SYS_OP_MAP_NONNULL("COL1")=SYS_OP_MAP_NONNULL("COL2"))


Statistics
----------------------------------------------------------
          1  recursive calls
          0  db block gets
      68456  consistent gets
          0  physical reads
          0  redo size
        346  bytes sent via SQL*Net to client
        364  bytes received via SQL*Net from client
          2  SQL*Net roundtrips to/from client
          0  sorts (memory)
          0  sorts (disk)
          1  rows processed

SQL>
SQL> select count(*) from t1 where col1 = col2 or (col1 is null and col2 is null);

Elapsed: 00:00:02.30

Execution Plan
----------------------------------------------------------
Plan hash value: 3724264953

---------------------------------------------------------------------------
| Id  | Operation          | Name | Rows  | Bytes | Cost (%CPU)| Time     |
---------------------------------------------------------------------------
|   0 | SELECT STATEMENT   |      |     1 |     4 | 18865   (2)| 00:03:47 |
|   1 |  SORT AGGREGATE    |      |     1 |     4 |            |          |
|*  2 |   TABLE ACCESS FULL| T1   |    13M|    49M| 18865   (2)| 00:03:47 |
---------------------------------------------------------------------------

Predicate Information (identified by operation id):
---------------------------------------------------

   2 - filter("COL1" IS NULL AND "COL2" IS NULL OR "COL1"="COL2")


Statistics
----------------------------------------------------------
          1  recursive calls
          0  db block gets
      68456  consistent gets
          0  physical reads
          0  redo size
        346  bytes sent via SQL*Net to client
        364  bytes received via SQL*Net from client
          2  SQL*Net roundtrips to/from client
          0  sorts (memory)
          0  sorts (disk)
          1  rows processed
Surprisingly, in my tests SYS_OP_MAP_NONNULL always performed worst, and the DECODE expression pretty close to the more verbose SQL expression - depending on the data set sometimes even faster.

So using SYS_OP_MAP_NONNULL, and in particular the implicit rewrite might not be such a good idea after all. And now you know how the automatic rewrite could be disabled if desired.