Showing posts with label Oracle Cloud. Show all posts

Monday, February 6, 2017

Oracle Database Cloud (DBaaS) Performance - Part 4 - Network

In the last part of this installment I'll have a brief look at the network performance measured in the Oracle DBaaS environment, in particular the network interface that gets used as private interconnect in case of RAC configuration. The network performance could also be relevant when evaluating how to transfer data to the cloud database.

I've used the freely available "iperf" tool to measure the network bandwidth and got the following results:

[root@test12102rac2 ~]# iperf3 -c 10.196.49.126
Connecting to host 10.196.49.126, port 5201
[  4] local 10.196.49.130 port 41647 connected to 10.196.49.126 port 5201
[ ID] Interval           Transfer     Bandwidth       Retr  Cwnd
[  4]   0.00-1.00   sec   651 MBytes  5.46 Gbits/sec   15    786 KBytes
[  4]   1.00-2.00   sec   823 MBytes  6.90 Gbits/sec   11   1.07 MBytes
[  4]   2.00-3.00   sec   789 MBytes  6.62 Gbits/sec    7   1014 KBytes
[  4]   3.00-4.00   sec   700 MBytes  5.87 Gbits/sec   39   1.04 MBytes
[  4]   4.00-5.00   sec   820 MBytes  6.88 Gbits/sec   21    909 KBytes
[  4]   5.00-6.00   sec   818 MBytes  6.86 Gbits/sec   17   1.17 MBytes
[  4]   6.00-7.00   sec   827 MBytes  6.94 Gbits/sec   21   1005 KBytes
[  4]   7.00-8.00   sec   792 MBytes  6.64 Gbits/sec    8    961 KBytes
[  4]   8.00-9.00   sec   767 MBytes  6.44 Gbits/sec    4   1.11 MBytes
[  4]   9.00-10.00  sec   823 MBytes  6.91 Gbits/sec    6   1.12 MBytes
- - - - - - - - - - - - - - - - - - - - - - - - -
[ ID] Interval           Transfer     Bandwidth       Retr
[  4]   0.00-10.00  sec  7.63 GBytes  6.55 Gbits/sec  149             sender
[  4]   0.00-10.00  sec  7.63 GBytes  6.55 Gbits/sec                  receiver

iperf Done.

So the network bandwidth seems to be something between 6 and 7 Gbits/sec, which is not too bad.

For completeness, the UDP results look like the following:

[root@test12102rac2 ~]# iperf3 -c 10.196.49.126 -u -b 10000M
Connecting to host 10.196.49.126, port 5201
[  4] local 10.196.49.130 port 55482 connected to 10.196.49.126 port 5201
[ ID] Interval           Transfer     Bandwidth       Total Datagrams
[  4]   0.00-1.00   sec   494 MBytes  4.14 Gbits/sec  63199
[  4]   1.00-2.00   sec   500 MBytes  4.20 Gbits/sec  64057
[  4]   2.00-3.00   sec   462 MBytes  3.87 Gbits/sec  59102
[  4]   3.00-4.00   sec   496 MBytes  4.16 Gbits/sec  63491
[  4]   4.00-5.00   sec   482 MBytes  4.05 Gbits/sec  61760
[  4]   5.00-6.00   sec   425 MBytes  3.57 Gbits/sec  54411
[  4]   6.00-7.00   sec   489 MBytes  4.10 Gbits/sec  62574
[  4]   7.00-8.00   sec   411 MBytes  3.45 Gbits/sec  52599
[  4]   8.00-9.00   sec   442 MBytes  3.71 Gbits/sec  56541
[  4]   9.00-10.00  sec   481 MBytes  4.04 Gbits/sec  61614
- - - - - - - - - - - - - - - - - - - - - - - - -
[ ID] Interval           Transfer     Bandwidth       Jitter    Lost/Total Datagrams
[  4]   0.00-10.00  sec  4.57 GBytes  3.93 Gbits/sec  0.028 ms  23434/599340 (3.9%)
[  4] Sent 599340 datagrams

iperf Done.

Finally, "ping" results look like the following:

9665 packets transmitted, 9665 received, 0% packet loss, time 9665700ms
rtt min/avg/max/mdev = 0.135/0.308/199.685/3.322 ms

So an average latency of 0.3 ms also doesn't look too bad.

[Update 6.2.2017]: Thanks to Frits Hoogland who pointed out the very high "max" value for the ping. Although I didn't spot the pattern that he saw in a different network test setup ("cross cloud platform"), which was an initial slowness, it's still worth to point out the high "max" value of almost 200 ms for a ping, and also the "mdev" value of 3.322 ms seems to suggest that there were some significant variations in ping times observed that are potentially hidden behind the average values provided. I'll repeat the ping test and see if I can reproduce these outliers and if yes, find out more details.

Monday, January 30, 2017

Oracle Database Cloud (DBaaS) Performance - Part 3 - Storage - 12.2 Update

Recently I repeated the I/O related tests on a 12.2.0.1 instance for curiosity and was surprised by the fact that I consistently got significantly better results as on 11.2.0.4 and 12.1.0.2.

Now you're probably aware that the version 12.2 so far is "cloud-only", so I can't tell / test whether the version 12.2 is generically providing that increased performance or whether Oracle has optimized the underlying stack, so that previous versions in general could also benefit from better performance if they ran on the same platform. Repeated tests with versions 11.2.0.4 and 12.1.0.2 confirmed the performance figures reported in the previous installment of this series, so as of the time of writing it's only the version 12.2 that provides the improved I/O performance.

Note that as of the time of writing only a single instance configuration was supported with version 12.2, so I wasn't able to run the tests in RAC configuration.

Here are the 12.2 I/O related test results:

IOPS

Again running the test on a 4 OCPU single instance configuration (results in 8 CPUs / 8 cores as outlined previously) with eight sessions:


So that is more than 65,000 IOPS on average at 8 KB block size, significantly more than the corresponding (and already impressive) 40,000 IOPS seen in the previous versions, and even at 16 KB block size still more than 50,000 IOPS - that is more than 800 MB / sec in single block requests!

I/O Throughput

Repeating the same Parallel Execution based test that first creates a very large table (8 KB block size, "direct path write") and then re-reads it using Parallel Query ("direct path read") I got the following results on the 4 OCPU single instance configuration:


Again the results are significantly improved over previous versions. The read performance improved from 640 MB / sec to almost 940 MB / sec. More importantly however the write performance improved from 120 MB / sec to 200 MB / sec, a performance that should allow even more write intensive workloads to perform well.

I/O Latency

The same test as previously was run, switching from asynchronous I/O ("db file parallel read") to synchronous I/O ("db file sequential read") allowing measurement of single block reads, running with 8 threads on the 4 OCPU / 8 CPU / cores configuration at 8 KB block size.


Again an significant improvement across all figures, 0.375 ms average wait time vs. 0.45 ms previously. almost 19,000 IOPS vs. 16,380 IOPS and more than 90% of the waits within 512 microseconds vs. 75% before.

Write Performance

With the significantly improved write throughput figures the expectation was that the random read + write test would perform much better than before, and it did:


In previous versions this test waited almost 50% on "free buffer waits" (due to the minimized buffer cache), so clearly the DBWR couldn't keep up with writing dirty blocks to disk. The picture has changed here significantly, with "free buffer waits" going down to just 4.5% of the overall database time, and performing almost 5,000 write requests per second (and almost 20,000 IOPS in total).

Note that the version 12.2 obviously introduces an optimization that treats repeated modifications of the same kind to the same block (in this case here update a column of a row to the same value as before) not as a "db block change", therefore I had to adjust the test to update the column value to a different value each time. Running the original test case showed a totally different profile, due the minimized "db block changes".

Summary

The 12.2 version in the Oracle Cloud shows a significantly improved I/O performance profile compared to previous versions. So far it is unclear whether that is a generic improvement of the new release, or the underlying stack used by the virtual machines has been optimized.

In particular the improved write performance is an important improvement.

Monday, January 23, 2017

Oracle Database Cloud (DBaaS) Performance - Part 2 - Storage

In this second part of this installment I'll focus on the performance figures related to I/O encountered when the corresponding tests were performed on the platform.

IOPS

When running with minimum sized buffer cache, direct and asynchronous I/O enabled, the following average read-only IOPS figures were measured over a period of several days (this is the test described in part three of the "performance consistency" series) .

First, running on a 4 OCPU single instance configuration (8 CPUs / 8 cores as outlined in the previous part) with either four or eight sessions:


Second, running on a 2+2 OCPU two instance RAC configuration (4+4 CPUs / 4+4 cores as outlined in the previous part) with either four or eight sessions:


So for the 8 KB block size the single instance test shows an average of almost 40.000 IOPS for read-only tests, and the two instance RAC even scales to almost 60.000 IOPS on average. These are pretty impressive IOPS figures for a general purpose shared / virtualized environment, and - at least - for the read part - are way above what other DBaaS cloud providers offer out of the box.

It's also worth mentioning that I got the same IOPS results independent from the amount of storage allocated - in contrast to Amazon RDS for example, where even the "Provisioned IOPS" storage class requires you to allocate at least 3 TB of storage in order to get the maximum of 30,000 IOPS. I've repeated the same test setup with the table size inflated to the maximum possible within my test account limitations (so total size of storage allocated close to the 1 TB storage quota) and still got comparable IOPS results to this test that only allocates approx. 1 GB for the 8 KB block size test (total storage allocated approx. 100 GB).

I/O Throughput

In order to measure the maximum I/O throughput corresponding Parallel Execution statements were used to create tables of sufficient size and read them via Parallel Query.

First, running on a 4 OCPU single instance configuration (8 CPUs / 8 cores as outlined in the previous part) at a degree of 16:


Second, running on a 2+2 OCPU two instance RAC configuration (4+4 CPUs / 4+4 cores as outlined in the previous part) at a degree of 16:


So the single instance configuration writes at 120 MB per second, and reads at 640 MB per second, whereas the two instance RAC configuration writes at 80 MB per second and reads at 1.100 MB per second. Clearly the storage layer is read optimized and writes are much slower than reads. The read performance is very good however, and again above what other cloud providers deliver (for example Amazon RDS "Provisioned IOPS" offers a maximum throughput of 320 MB per second, but again only if a sufficient amount of storage is allocated).

I/O Latency

In order to measure the I/O latency the test used above to determine the IOPS rate was modified to use random single block reads ("db file sequential read") instead of asynchronous reads ("db file parallel read"). The reason for this is that from a database perspective the latency for reads performed asynchronously cannot be measured properly, due to the way the database handles the I/O.

The results were the following, this time running on a 2 OCPU (4 CPUs / 4 cores) single instance configuration with 8 KB block size and 8 sessions:


So again rather impressive 0.45 ms average wait time for a random single block read, and the wait event histogram also shows that the performance was very consistent, with almost 75 percent of the waits taking less than 512 microseconds at a rate of more than 16.000 IOPS.

Write Performance

The read-only test above was modified to be 100 percent updates (for more details see here). Since the instance was configured to operate with a minimum sized buffer cache this puts maximum pressure on the database writer to write dirty blocks as fast as possible in order to allow new blocks to be read into the buffer cache.

Running on a 4 OCPU single instance configuration (8 CPUs / 8 cores) with eight sessions the following profile was measured - using NOARCHIVELOG mode and Flashback disabled:


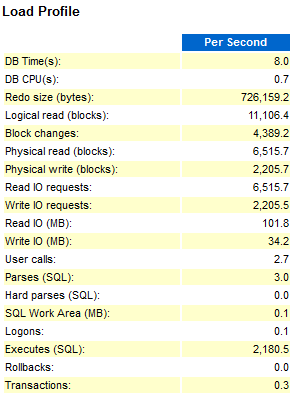
So clearly the database writer couldn't write the dirty blocks quick enough - almost 50 percent of the database time the sessions had to wait for free buffers. This means that write intensive workloads might not work too well and run into these limitations.

Summary

The storage layer is clearly optimized for reads and delivers at least for the read-only tests a very good I/O performance. Write intensive workloads might not work too well if they consistently require more write performance than provided by the service.

Tuesday, January 3, 2017

Oracle Database Cloud (DBaaS) Performance - Part 1 - CPU

After having looked at the performance consistency provided by the Oracle Database Cloud offering in the previous series, I'll focus here on the raw performance figures I've measured during my tests, starting with the CPU related performance findings.

One of the first surprises is related to the fact that Oracle uses a unit called "OCPU" to specify the CPU capacity provided, which is explained here:

So one "OCPU" is supposed to represent one core with two Hyperthreading CPU threads, and hence should correspond for example to two VCPUs used as unit by Amazon.

But when looking at the actual CPU configuration of such a DBaaS VM, I got the following results for a 4 OCPU configuration:


So, that 4 OCPU configuration provides 8 CPUs, which is expected, but it provides those 8 CPUs with one thread per core, so that means 8 cores.

This is what I get when I configure a corresponding Amazon EC2 VM with 8 VCPUs (m4.2xlarge), which should be same as the Amazon RDS "db.m4.2xlarge" configuration (but I can't access a RDS instance on O/S level, hence the EC2 fallback):

Architecture:          x86_64
CPU op-mode(s):        32-bit, 64-bit
Byte Order:            Little Endian
CPU(s):                8
On-line CPU(s) list:   0-7
Thread(s) per core:    2
Core(s) per socket:    4
 

Socket(s):             1
NUMA node(s):          1
Vendor ID:             GenuineIntel
CPU family:            6
Model:                 79
Model name:            Intel(R) Xeon(R) CPU E5-2686 v4 @ 2.30GHz
Stepping:              1
CPU MHz:               2300.062
BogoMIPS:              4600.12
Hypervisor vendor:     Xen
Virtualization type:   full
L1d cache:             32K
L1i cache:             32K
L2 cache:              256K
L3 cache:              46080K
NUMA node0 CPU(s):     0-7


So this more in line to what is expected - 4 cores providing 8 CPU threads.

Does it make a difference in terms of actual performance? It does - when running my CPU tests, both the PL/SQL as well as the SQL engine based tests (see the previous "performance consistency" series for more details about the tests) show the following average duration per iteration per thread when running with 4 vs. 8 threads:

Oracle DBaaS:

 Amazon RDS:

So, using 8 threads instead of 4 threads only increases the duration of a test iteration slightly in the Oracle DBaaS 4 OCPU environment, whereas the Amazon RDS 8 VCPU environment significantly slows down, even more than expected considering Hyperthreading effects - in particular the SQL Logical I/O test requires more than twice of the time at 8 threads, but the PL/SQL based test, too, significantly slows down. It's interesting to see that running the SQL Logical I/O test at 4 threads the Amazon RDS environment outperforms the Oracle DBaaS offering to an unexpected degree.

Whether the better Amazon RDS SQL Logical I/O performance at 4 threads comes from the larger cache sizes reported by "lscpu" I don't know. I also don't know why Oracle provides more cores than outlined in their own product description. Maybe this should avoid exactly the effects seen with the Amazon RDS environment - maybe Hyperthreading doesn't work that well in virtualized environments - but that is just my speculation. Whether Oracle will keep this different approach in future I don't know either.

All I can say is that I consistently got that CPU / core ratio when configuring several services using a different number of OCPUs and that the my performance tests showed the difference outlined above when comparing the Oracle DBaaS and Amazon RDS environments.

Monday, November 7, 2016

Oracle Database Cloud (DBaaS) Performance Consistency - Part 7

This part of the series is supposed to cover the results of I/O related tests performed on the Amazon RDS Oracle cloud instance.
As mentioned in the previous part of this series I've only used the "General Purpose SSD" storage type since the "Provisioned IOPS" storage was simply to expensive to me and it wasn't possible to get a trial license for that storage type.

Now one key aspect of the "General Purpose SSD" storage offered by Amazon RDS is that it is limited to a peak IOPS performance of 3.000 IOPS, and this peak performance will be delivered only for a limited amount of time if you happen to have storage allocated less than 1.000GB - more details can be found on the Amazon RDS documentation.
So in my case since I did a comparison to the Oracle Cloud setup with just 100GB of storage allocated this configuration was only capable of sustaining the peak performance of 3.000 IOPS for a maximum of 2.000 seconds, which is a little more than 30 minutes.
After that the IOPS rate gets limited to the base rate, which in my case here was just 300 IOPS.
Effectively this meant with that configuration I could simply not perform the same I/O heavy tests reasonably - each loop iteration would have taken hours, and then again I didn't plan to run the tests for a very long time since it would simply become too expensive.
To give an idea how running the same test setup would have performed on this Amazon RDS "General Purpose SSD" storage, here is the individual thread performance for the "read-only" I/O test (for details see this blog post, at the end of that post you can also find the median runtimes for the Oracle Cloud DBaaS offering):
So after using up the "I/O credits" for the peak IOPS performance, which is still 10 times slower than the IOPS rate of the Oracle Clould DBaaS offering (approximately 640 seconds per iteration vs. 64 seconds, 3.000 vs. 30.000 IOPS), the rate drops to 300+ IOPS, meaning loop iteration runtimes of 4.500+ seconds - this more than one hour! to run a single iteration of the test that takes slightly more than a minute on the Oracle Cloud DBaaS offering.
I stopped the I/O tests there since I didn't see a point in continuing this further - the two offerings simply can't be compared on that basis. It would have been different when using the "Provisioned IOPS" storage configuration, but that was simply too expensive for such a small test.

Sunday, October 23, 2016

Oracle Database Cloud (DBaaS) Performance Consistency - Part 6

In the next parts of this series I'll have a look at the results of similar performance consistency tests performed on a comparable Amazon RDS Oracle cloud database instance.

Let's start with the configuration used, which was an Amazon RDS "db.m4.2xlarge" instance - the latest RDS generation available at time of testing. This is an 8 VCPUs resp. Hyper Threads / 4 cores configuration with 32GB of RAM.
As storage I've used the "General Purpose SSD" setup. Although there is a "Provisioned IOPS" configuration available, too, I haven't used for testing because according to the price calculator available it would have costed me several hundred dollar even for a very short period of testing because some part of the configuration gets charged per month, no matter how long I actually use it. I'll get back to that point when dealing with the I/O related tests and the raw performance figures.
Therefore I've only run the tests on the "General Purpose SSD" configuration - more on that in later installments.
Even without the "Provisioned IOPS" storage the tests were only conducted for several hours instead of several days, therefore they can't be compared directly to the other test results.
The first test conducted was the "PL/SQL" CPU burning test I've outlined in the first part of this series.
The overall consistency result looked like this:

Again the graph is supposed to show how many of the runs deviated how much from the overall median runtime. The results - at least for the short period of the test run - are very consistent, similar to the other test results.
Looking at the results on a more granular basis is only of limited use in this case due to the short test run time, hence the resolution is changed to hours instead of days here:
There were a couple of hours that show a very similar behaviour and again another set of hours with rather a similar profile, and there is an hour with a rather unusual profile.
Finally, looking at the runtime of the individual threads:
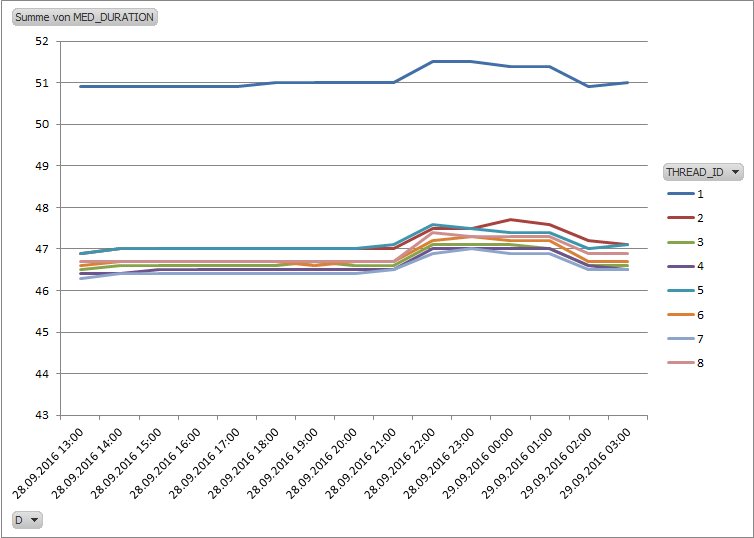
Except for one threads all other show a very similar runtime, also the runtime is very consistent.
It should be noted however, that the actual raw performance of each thread is pretty different from that of the Oracle DBaaS offering based on 4 OCPUs, because the DBaaS offering actually provides 8 cores, and hence scales much better when running with 8 threads - see the corresponding previous test results. The Amazon RDS raw performance is more comparable to that of the 4 cores physical host used in the previous tests for comparison.

Monday, October 17, 2016

Oracle Database Cloud (DBaaS) Performance Consistency - Part 5

This is the fifth part of this installment, and before coming to comparisons to other cloud providers, in this part I show the results of the read-only test that I've already described in part three of this series, but repeated at a later point in time. The test setup was identical and can be checked in the mentioned previous part.

The reason for running the test again was the fact that I was informed during the first test run that the zone that my Oracle Cloud domain was assigned to was temporarily overloaded, which I also noticed since I wasn't able to create new services for some time.

Hence I decided to repeat the tests after it was confirmed that the issue got resolved.

So here is a comparison of the second test run results compared to the first test run - the corresponding results for the dedicated physical host can be found in part three.

Overall consistency second run:


Overall consistency first run:


Again the graph is supposed to show how many of the runs deviated how much from the overall median runtime. The second run shows a much improved overall consistency much closer to that of the dedicated physical host, although a few outliers are more extreme than in the first run,

The same data on per day basis, second run:


First run:


Except for the first two days the second run shows a pretty consistent behaviour per day, and it becomes obvious that it's the second day of the second run that is responsible for the extreme outliers and also the significant inconsistency in the area between 8 and 12 percent deviation.

Finally the individual thread performance, second run:


First run:


The individual thread performance graph confirms the much improved consistency compared to the first run.

Monday, October 3, 2016

Oracle Database Cloud (DBaaS) Performance Consistency - Part 4

This is the fourth part of this installment, comparing the performance consistency of the DBaaS cloud offering with a dedicated physical host. This time the previous read-only test was modified to be a 100% update read-write test. So every row read was updated in the following way:

begin
  loop
    for rec in (
          select /*+
              index(t_o)
           */
          id_fk
    from
          t_o
    ) loop
      update t_i&tabname t_i
      set n = rec.id_fk
      where id = rec.id_fk;
    end loop;
    insert into timings(testtype, thread_id, ts) values ('&testtype', &thread_id, systimestamp);
    commit;
  end loop;
end;
/

The setup of the tables T_O and T_I<n> was identical to the previous read-only test and can be checked in part 3 of this series. Again this was executed by several sessions concurrently, this time by 8 sessions on both the DBaaS database and the dedicated physical host - since this wasn't CPU bound and due to better write performance the dedicated physical host could keep up with the load at 8 sessions.
Due to the minimum buffer cache used, the way the data and test is crafted this setup puts maximum pressure of the DBWR background process, due to the constant need to read new blocks into the small buffer cache and write dirty blocks at the same time. By choosing a large block size of 16KB and at the same time using a very small actual change data volume the log writer didn't play a role in this test here. Both databases operated in NOARCHIVELOG mode and with Flashback disabled.
The test showed that for this setup the DBWR for the DBaaS database was not capable of writing the data fast enough, so that significant time was spent on "free buffer waits", waiting for the DBWR to free up buffers by writing dirty blocks to disk, amplified by the faster read I/O of the DBaaS service compared to the dedicated physical host. The DBaaS storage obviously is optimized for reads - having to write encrypted blocks makes things not faster - the dedicated physical host didn't use TDE encryption. In a separate Parallel Execution test the DBaaS service performed a maximum read throughput of 640 MB per second and 120 MB per second write throughput.
A sample AWR Top profile looked like this:
DBaaS:


Physical Host:


Unfortunately this test could only be executed for a couple of hours on the dedicated physical host and had then to be stopped due to technical problems, distorting some of the following charts.
The overall consistency graph looked like this:

DBaaS:

Physical host:


Again the graph is supposed to show how many of the runs deviated how much from the overall median runtime. Again the DBaaS service shows a significantly different profile, but this time performed more consistently than in the previous read-only test - the probable reason for the difference will be explained in a later part of this series. The DBaaS service this time had some extreme outliers (max. > 160 percent deviation) that I didn't include in the graph to not distort the graph too much - but it were just a few runs out of more than 25.000 that were affected.

The same data on per day (per hour for the physical host) basis:

DBaaS:


Physical host:


As mentioned above the physical host data covers only a few hours and hence can't really be compared to the DBaaS data covering more than a week of data.

Finally the individual thread performance:

DBaaS:


Physical host:


Both environments show pretty stable run times per thread over time, and the graphs confirm what is mentioned above: The physical host this time outperforms the DBaaS, however, as already mentioned, a slightly unfair comparison as the physical host didn't had to read and write encrypted blocks.

The next parts will cover comparisons to other cloud providers.

Sunday, August 28, 2016

Oracle Database Cloud (DBaaS) Performance Consistency - Part 3

This is the third part of this installment, comparing the performance consistency of the DBaaS cloud offering with a dedicated physical host. This time instead of burning CPU using logical I/O only (see part 2) the test harness executes a SQL statement that has to perform physical I/O mostly, and to be more precise this round is a read-only test, so doesn't include any modification to data (except the logging and any other background system generated write activity, like maintaining ASH /AWR data etc.).

In order to maximize the physical I/O part the database instance was configured with a minimum sized buffer cache (16k block size in this case) and the following script was executed as many times as CPUs were available:

declare
  n number;
begin
  loop
    select /*+
              leading(t_o)
              use_nl(t_i)
              index(t_o)
              index(t_i)
          */
          sum(t_i.n)
          into n
    from
          t_o
        , t_i&tabname t_i
    where
          t_o.id_fk = t_i.id;
    insert into timings(testtype, thread_id, ts) values ('&testtype', &thread_id, systimestamp);
    commit;
  end loop;
end;
/

The outer table T_O was created like this:

create table t_o (id primary key, id_fk)
organization index
as
select
       rownum as id
     , case mod(rownum, 2) + 1
       when 1
       then mod(rownum, &tab_size / 20)
       else &tab_size / 10 - mod(rownum, &tab_size / 20) + 1
       end as id_fk
from dual

connect by level <= &tab_size;

Each thread got its dedicated inner table of the Nested Loop join, created like this:

create table t_i' || i || ' (id not null, n, filler)
pctfree 99 pctused 1
tablespace &tbs
as
select cast(rownum as integer) as id,
cast(rownum as number) as n,
cast(rpad('x', 200) as varchar2(200)) as filler
from dual

connect by level <= &tab_size / 10;

create index t_i' || i || '_idx on t_i' || i || ' (id, filler) pctfree 99 tablespace &tbs;


Due to the way the data was crafted and thanks to the Nested Loop join batching performed by Oracle this ensured that the sessions were performing "db file parallel read" I/O as much and hard as possible, so were submitting multiple I/O requests using a single call and taking advantage of asynchronous I/O where possible.

When running with 8 threads on those 8 CPUs on the DBaaS service this resulted in approx. 30.000 IOPS for those 16K blocks (approx. 480MB / sec throughput). Note that I got these 30.000 IOPS for 16K blocks also on a different instance with just 4 CPUs (2 OCPUs) and 4 threads, so it looks like this is a common 16K blocks IOPS limit for a DBaaS instance independently from the CPU count without further tweaking (I didn't attempt to optimize this in any way but used the service as provided / configured by the Oracle Cloud). It looks like this is more a throughput limitation at 480MB / sec than an IOPS limitation, because when using a 4K blocksize I was able to get 60.000 IOPS (middle value), but the IOPS rate was much more fluctuating (between 20.000 and 90.000) whereas the 30.000 IOPS using 16K blocksize was pretty much stable.

On the physical host I got approx. half of these IOPS (roughly 15.500) for those 16K blocks (approx. 250MB / sec throughput), which is very likely the throughput limit for the rather outdated hardware configuration, albeit using a rather modern Samsung SSD drive, but also meant that running at 4 threads I got a comparable number of IOPS per thread as in the DBaaS setup. Using a 4K blocksize the physical host maxed out at (very stable) 52.000 IOPS.

The overall results look like this:

DBaaS:


Physical host:


Again the graph is supposed to show how many of the runs deviated how much from the overall median runtime. Similar to the previous, logical I/O only test this time the DBaaS service shows a significantly different profile, with an even larger spread of deviation up to almost 9 percent from the median runtime, whereas the physical host only shows significant deviation up to 2.5 percent.

Again, like in the previous test, the physical host shows more extreme outliers than the DBaaS service.

The same graph on a per day basis this time shows significant differences between the days for the DBaaS service:
The physical host shows a very common pattern, except for the first day:
Looking at the individual performance of each thread the DBaaS shows a significant variation in performance per day:
The physical host shows a pretty consistent performance pattern, but interestingly the different threads show different, but consistent runtimes:
The next test round will include physical writes.

Sunday, August 7, 2016

Oracle Database Cloud (DBaaS) Performance Consistency - Part 2

This is the second part of this installment, comparing the performance consistency of the DBaaS cloud offering with a dedicated physical host. This time instead of burning CPU using a trivial PL/SQL loop (see part 1) the test harness executes a SQL statement that performs logical I/O only, so no physical I/O involved.

In order to achieve that a variation of Jonathan Lewis' good old "kill_cpu" script got executed. In principle each thread performed the following:

define tabname = &1

define thread_id = &1;

alter session set "_old_connect_by_enabled" = true;

declare
  n number;
begin
  loop
    select
   count(*) X
    into    n
    from
   kill_cpu&tabname
    connect by
   n > prior n
    start with
   n = 1;
    insert into timings(testtype, thread_id, ts) values ('SQLLIO', &thread_id, systimestamp);
    commit;
  end loop;
end;
/

Each thread got its own, exclusive "kill_cpu<n>" table, so this setup attempted to avoid competition for buffer cache latches. The tables (in fact IOTs) were created like the following:

create table kill_cpu<n>(n primary key)
organization index
as
select
rownum n
from
all_objects
where
rownum <= 25
;

Again there were as many threads started as CPUs available - which meant 8 threads for the DBaaS environment and 4 threads for the physical host and again this was left running for several days.
The overall results look like this:
DBaaS:
Physical host:
Again the graph is supposed to show how many of the runs deviated how much from the overall median runtime. In contrast to the previous, simple PL/SQL test this time the DBaaS service shows a significantly different profile with a larger spread of deviation up to 3 percent from the median runtime, whereas the physical host only shows significant deviation up to 1.5 percent.
It's interesting to note however, that the physical host this time shows more extreme outliers than the DBaaS service, which was the other way around in the previous PL/SQL test.

The same graph on a per day basis doesn't show too significant differences between the days for either environment (here DBaaS):
Physical host:
Looking at the individual performance of each thread again the DBaaS shows a similar behaviour than last time - the different threads show a slightly different performance, and they also get slightly slower towards the end of the measurement:
And again the physical host shows a more consistent performance between threads:
The next test round will be a physical I/O bound setup.