begin
loop
for rec in (
select /*+
index(t_o)
*/
id_fk
from
t_o
) loop
update t_i&tabname t_i
set n = rec.id_fk
where id = rec.id_fk;
end loop;
insert into timings(testtype, thread_id, ts) values ('&testtype', &thread_id, systimestamp);
commit;
end loop;
end;
/
The setup of the tables T_O and T_I<n> was identical to the previous read-only test and can be checked in part 3 of this series. Again this was executed by several sessions concurrently, this time by 8 sessions on both the DBaaS database and the dedicated physical host - since this wasn't CPU bound and due to better write performance the dedicated physical host could keep up with the load at 8 sessions.
Due to the minimum buffer cache used, the way the data and test is crafted this setup puts maximum pressure of the DBWR background process, due to the constant need to read new blocks into the small buffer cache and write dirty blocks at the same time. By choosing a large block size of 16KB and at the same time using a very small actual change data volume the log writer didn't play a role in this test here. Both databases operated in NOARCHIVELOG mode and with Flashback disabled.
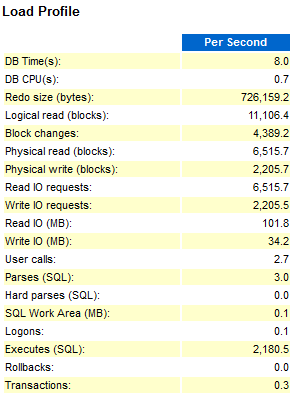
The test showed that for this setup the DBWR for the DBaaS database was not capable of writing the data fast enough, so that significant time was spent on "free buffer waits", waiting for the DBWR to free up buffers by writing dirty blocks to disk, amplified by the faster read I/O of the DBaaS service compared to the dedicated physical host. The DBaaS storage obviously is optimized for reads - having to write encrypted blocks makes things not faster - the dedicated physical host didn't use TDE encryption. In a separate Parallel Execution test the DBaaS service performed a maximum read throughput of 640 MB per second and 120 MB per second write throughput.
A sample AWR Top profile looked like this:
DBaaS:
Unfortunately this test could only be executed for a couple of hours on the dedicated physical host and had then to be stopped due to technical problems, distorting some of the following charts.
Again the graph is supposed to show how many of the runs deviated how much from the overall median runtime. Again the DBaaS service shows a significantly different profile, but this time performed more consistently than in the previous read-only test - the probable reason for the difference will be explained in a later part of this series. The DBaaS service this time had some extreme outliers (max. > 160 percent deviation) that I didn't include in the graph to not distort the graph too much - but it were just a few runs out of more than 25.000 that were affected.
The same data on per day (per hour for the physical host) basis:
DBaaS:
Physical host:
As mentioned above the physical host data covers only a few hours and hence can't really be compared to the DBaaS data covering more than a week of data.
Finally the individual thread performance:
DBaaS:
Physical host:
Both environments show pretty stable run times per thread over time, and the graphs confirm what is mentioned above: The physical host this time outperforms the DBaaS, however, as already mentioned, a slightly unfair comparison as the physical host didn't had to read and write encrypted blocks.
The next parts will cover comparisons to other cloud providers.


No comments:
Post a Comment
Note: Only a member of this blog may post a comment.