Wednesday, March 14, 2018

No Asynchronous I/O When Using Shared Server (Also Known As MTS)

I've recently had a case at a client where it was questioned why a particular application was seemingly not making full use of the available I/O capabilities - in comparison to other databases / applications using similar storage.

Basically it ended up in a kind of finger pointing between the application vendor and the IT DBA / storage admins, one side saying that the infrastructure used offers insufficient I/O capabilities (since the most important application tasks where dominated by I/O waits in the database), and the other side saying that the application doesn't make use of the I/O capabilities offered - compared to other databases / applications that showed a significantly higher IOPS rate and/or I/O throughput using the same kind of storage.

At the end it turned out that in some way both sides were right, because the application made use of a somewhat unusual configuration for batch processing: Due to very slow Dedicated Server connection establishment that slowed down some other, more interactive part of the application, the database and client connection strings were configured to use Shared Server connections by default for all parts of the application. This successfully solved the connection establishment problem but obviously introduced another, so far not recognized problem.

Using my recently published I/O benchmark we performed some tests to measure the maximum IOPS and throughput of that specific database independently from the application, and the results were surprising, because in particular the test variations that were supposed to perform asynchronous physical read single block ("db file parallel read") and multi block I/O ("direct path read") didn't do so, but showed synchronous I/O only ("db file sequential read" / "db file scattered read").

After some investigations it became obvious the reason for this behaviour was the usage of the Shared Server architecture - simply switching to Dedicated Server sessions showed the expected behaviour and also a significantly higher maximum IOPS rate and I/O throughput at the same level of concurrency.

It's very easy to reproduce this, using for example my read IOPS and throughput benchmark scripts and performing the benchmark using either Shared or Dedicated Server architecture in asynchronous I/O mode.

For example, this is what I get running this on my laptop using Dedicated Server and testing maximum read I/O throughput in asynchronous I/O mode (which should result in "direct path read" operations bypassing the buffer cache):


If I repeat exactly the same test (same settings, number of processes, size of objects etc.) using Shared Server architecture, this is what I get:


This is particularly interesting - no direct path reads although the benchmark sessions set in this case "_serial_direct_read" = 'always'.

In principle the same can be seen when running the maximum read IOPS benchmark, here is the expected result when using Dedicated Servers in asynchronous I/O mode:


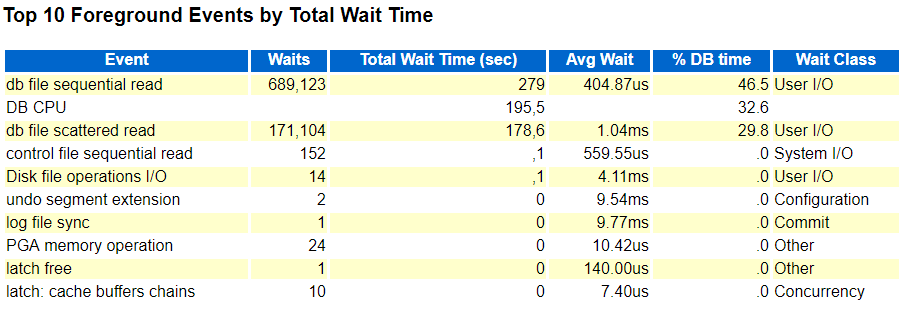
And again, this is what I get when running the same test using Shared Servers:


Again no sign of asynchronous I/O ("db file parallel read") - and the achieved IOPS rate is significantly lower, which is exactly what the client experienced, much more DB time waiting for I/O and less time spent on CPU than expected. Depending on the particular storage configuration and latency the difference when using the same number of processes can be even more significant, I've seen up to factor 20 difference in achieved IOPS rate, and factor 3 to 4 is quite typical. Of course as usual how relevant this really is all depends on the actual query, execution plan and data pattern and where most of the time is spent.

Also, it is important to point out that all this might not be too relevant to most configurations, since Shared Servers aren't used that much nowadays in the times of application servers / connection pools dominating typical environments. Also it's probably rather uncommon to use Shared Servers for batch processing tasks like this client did.

Although Shared Servers were originally designed for typical OLTP applications having many open sessions being idle most of the time and performing mostly very simple and straightforward operations (like looking up a few rows via an efficient index access path) it's still interesting to see this limitation that can be quite significant depending on the I/O patterns used. So far I've not seen this documented anywhere, also on MyOracleSupport I couldn't find any matching notes describing the behaviour, and unfortunately no Service Request was opened for the issue yet.

When using Parallel Execution, by the way, which is also very unlikely when using Shared Servers but perfectly possible (the Shared Server session then acts as Query Coordinator), the Parallel Servers can make use of asynchronous I/O - so the limitation only seems to apply to the Shared Server session itself. I can think of some reasons why this limitation could be explained from an implementation point of view the way Shared Servers work, but this is of course only speculation.

All currently relevant versions show the same behaviour in that regard, by the way. I've reproduced this on 11.2.0.4, 12.1.0.2 and 12.2.0.1 on Windows as well as on Linux.

Wednesday, March 7, 2018

Oracle Database Physical I/O IOPS And Throughput Benchmark

General Information

I've used a similar set of scripts quite a few times now to provide feedback to customers that wanted to get a more realistic picture of the I/O capabilities from a database perspective, rather than relying on artificial benchmarks performed outside - or even inside, think of I/O calibration - the database. Although there are already several Oracle benchmark toolkits available, like Swingbench and in particular SLOB, that run inside the database I was looking for a very simplistic and straightforward I/O benchmark that comes with minimum overhead and in principle allows maximizing I/O from the database perspective, so using regular Oracle database codepaths based on SQL execution plans, I/O calls performed as part of that, involving the database buffer cache where applicable and in particular supports focusing on specific I/O patterns (which might be unique to this benchmark toolkit). Therefore I've developed a set of simple scripts that support in total four different I/O tests:

- Single and multi block physical reads

- Single and multi block physical writes

In case of the physical read tests support for synchronous and asynchronous reads is provided, which can be controlled via a corresponding input / parameter to the script.

In terms of instrumentation / internal implementation this corresponds to:

- synchronous single block reads: "db file sequential read" / "cell single block physical read" on Exadata

- asynchronous single block reads: "db file parallel read" / "cell list of blocks physical read" on Exadata

- synchronous multi block reads: "db file scattered read" / "cell multiblock physical read" on Exadata

- asynchronous multi block reads: "direct path read" / "cell smart table/index scan" on Exadata

The physical write tests should mainly trigger "db file parallel write" in case of the single block writes and "direct path write" in case of the multi block writes. Of course when it comes to DML activity things get more complicated in terms of the actual database activity triggered, in particular the additional undo / redo / archiving / potential standby activity. Note that if you're using an auto-extensible Undo tablespace configuration, running the single block physical write tests might increase the size of your Undo tablespace - you have been warned.

So each I/O test generates a specific I/O pattern (except for the single block write test that can also trigger synchronous single block reads, see the script for more details). The basic idea is to run just one of the tests to maximize the specific I/O pattern, but of course nothing stops you from running several of the tests at the same time  (would require different schemas to use for each test because otherwise object names dropped / created will collide / overlap) which will result in a mixture of I/O patterns. There is no synchronisation though in terms of starting / stopping / generating performance report snapshots etc. when running multiple of these tests at the same time, so you would probably have to take care of that yourself. So far I've not tested this, so it might not work out as just described.

In case of the physical read tests (except for the asynchronous "direct path read" that bypasses the buffer cache by definition) using too small objects / a too large buffer cache can turn this into a CPU / logical I/O test instead, so in principle you could use those tests for generating mainly CPU load instead of physical I/O (and provided the physical I/O is quick enough the CPU usage will be significant anyway), but that is not the intended usage of the scripts.

The scripts allow control over the size of the objects created and also support placing in specific buffer caches via the STORAGE clause (like RECYCLE or KEEP cache), so it is up to you to create objects of a suitable size depending on your configuration and intended usage.

Usage

Update: I've published a tutorial on my Youtube channel how to use the scripts.

Please note - the scripts are freely available and come with no warranty at all - so please use at your own risk.

In principle the scripts can be downloaded from my github repository - ideally pick the IO_BENCHMARK.ZIP which contains all required scripts, and should simply be extracted into some directory. Since the four different I/O tests are so similar, there is a subdirectory "common" under "io_benchmark" that holds all the common script parts and the main scripts then just call these common scripts where applicable.

The benchmark scripts consist of four similar sets:

max_read_iops_benchmark*: Single block reads synchronous / asynchronous

max_read_throughput_benchmark*: Multi block reads synchronous / asynchronous

max_write_iops_benchmark*: Single block writes - optionally mixed with synchronous single block reads (depends on object vs. buffer cache size)

max_write_throughput_benchmark*: Multi block direct writes

Each set consists of three scripts - an interactive guided script prompting for inputs used as parameters for the actual benchmark harness that in turn will launch another "slave" script as many times as desired to run the concurrent benchmark code.

There are in principle two different ways how the scripts can be used:

1. For each set there is a script that is supposed to be used from a SYSDBA account and guides through the different options available (*interactive). It will drop and re-create a schema to be used for the benchmark and grant the minimum privileges required to create the objects and run the benchmark. At the end of this interactive script it will connect as the user just created and run the benchmark. You can also use this script to clean-up afterwards, which is dropping the user created and stopping the script at that point.

2. The interactive script just calls the main benchmark harness with the parameters specified, so if you already have everything in place (check the "interactive_create_user.sql" in the "common" script subdirectory for details what privileges are required) to run the benchmark you can simply connect as the intended user, call the actual benchmark script and specify the parameters as desired - it will use defaults for any parameter not explicitly specified - check the script header for more details. Please note that I haven't tested running the actual benchmark as SYS respectively SYSDBA and I wouldn't recommend doing so. Instead use a dedicated user / schema as created by the interactive script part.

Each set of scripts consists of a third script which is the "slave" script being called as many times concurrently as specified to perform the actual benchmark activity.

The scripts will generate objects, typically as part of the preparation steps before the actual concurrent benchmark activity starts, or in case of the multi block write test, the object creation is the actual benchmark activity.

After the benchmark ran for the specified amount of time (600 seconds / 10 minutes default) the "slaves" will be shut down (if they haven't done so automatically) and the corresponding information about the IOPS / throughput rate achieved will be shown, based on (G)V$SYSMETRIC_HISTORY, so at least 120 seconds of runtime are required to have this final query to show something meaningful (to ensure that at least one 60 seconds interval is fully covered).

In addition the script by default will generate performance report snapshots (either AWR or STATSPACK) and display the corresponding report at the end. The file name generated describes the test performed along with the most important parameters (parallel degree, I/O mode (sync / async), object size, duration, timestamp etc.) Note that the script on Unix/Linux makes use of the "xdg-open" utility to open the generated report, so the "xdg-utils" package would be required to be installed to have this working as intended.

Note that in 12.2.0.1 the PDB level reports and metrics seem to miss "physical single block writes" performed by the DB Writer, so effectively evaluating / running this benchmark in 12.2.0.1 on PDB level won't report anything meaningful - you would have to resort to reports on CDB level instead, which I haven't implemented (actually I had to put in some effort to use the PDB level AWR reports and metrics in 12.2, so hopefully Oracle will fix this in future versions).

Finally the benchmark script will clean up and drop the objects created for the benchmark.

In principle the benchmark scripts should cope with all kinds of configurations: Windows / Unix / Linux, Single Instance / RAC, Standard / Enterprise Edition, PDB / Non-PDB, Non-Exadata / Exadata, and support versions from 11.2.0.4 on. It might run on lower versions, too, but not tested, and of course 18c (12.2.0.2) is not available on premises yet at the time of writing this, so not tested either.

But since this is an initial 1.0 version it obviously wasn't tested in all possible combinations / configurations / parameter settings, so expect some glitches. Feedback and ideas how to improve are welcome.

Where applicable the benchmark harness script also generates two tables EVENT_HISTOGRAM_MICRO1 and EVENT_HISTOGRAM_MICRO2 which are snapshots of GV$EVENT_HISTOGRAM_MICRO available from 12.1 on for synchronous single / multi block reads. The "harness" scripts provide a suitable query in the script header to display the latency histogram information nicely.

Happy I/O benchmarking!