A new version 4.23 of the XPLAN_ASH utility is available for download.
As usual the latest version can be downloaded here.
This version comes only with minor changes, see the change log below.
Here are the notes from the change log:
- Finally corrected the very old and wrong description of "wait times" in the script comments, where it was talking about "in-flight" wait events but that is not correct. ASH performs a "fix-up" of the last 255 samples or so and updates them with the time waited, so these wait events are not "in-flight"
- Removed some of the clean up code added in 4.22 to the beginning of the script, because it doesn't really help much but spooled script output always contained these error messages about non-existent column definitions being cleared
- The "Concurrent I/O" sections will now also be skipped in LIMITED_ASH mode
- Some more fixes to the I/O figures in the "Activity Timeline based on ASH" - the spreading introduced in 4.22 needed some further refinement (see 4.22 change log for more details)
Wednesday, June 29, 2016
Wednesday, June 8, 2016
Combining Features - Wrong Results With Scalar Subquery Caching
Quite often you can get into trouble with Oracle when you start combining different features.
In this case of one my clients it is the combination of user-defined PL/SQL functions that can raise exceptions (think of currency conversion and a non-existent currency code gets passed into the function), DML error logging and attempting to improve performance by wrapping the PL/SQL function call into a scalar subquery to benefit from the built-in scalar subquery caching feature of the SQL runtime engine.
As long as the scalar subquery didn't get used everything worked as expected, but after adding the scalar subquery after some while it became obvious that wrong results occurred - in that particular case here it meant rows that should have been rejected and written to the error logging table due to the exception raised in the user-defined PL/SQL function suddenly showed up in the target table, and what was even more worrying - they included a converted amount, obviously using some arbitrary conversion rate, although the PL/SQL function actually didn't return any value but raised an exception for unknown currency codes.
The interesting point here is that everything works as expected if the error logging feature doesn't get used, or if the scalar subquery doesn't get used.
In case of no error logging the whole statement will roll back if an exception occurs, and that holds true and works even with scalar subquery caching in place.
Without scalar subquery caching the correct result gets produced, all rows that are supposed to be rejected are written to the error logging table and don't show up in the target table.
And if no exception gets raised (only valid and existing currency codes get used), again the results are correct in the target table even when using scalar subquery caching - so the caching of the values in principle works correctly.
Only when combining those features and dealing with invalid data the problem shows up, and as it can be demonstrated from a simple test case, even then it only occurs under certain circumstances.
Here is a simple test case for reproducing the issue:
set echo on timing on time on

drop table t_source purge;

drop table t_dest purge;

drop table ERR$_T_DEST purge;

drop package test_plsql_caching_with_except;

create table t_source
as
select
        rownum as id
      , cast('C' || to_char(round(trunc(rownum / 100000)) + 1, 'FM00') as varchar2(3)) as currency_code_clust
      , cast('C' || to_char(mod(rownum, 10) + 1, 'FM00') as varchar2(3)) as currency_code_scat
      , 100 as amount
from
       (select /*+ cardinality(1e3) */ null from dual connect by level <= 1e3) gen1
     , (select /*+ cardinality(1e3) */ null from dual connect by level <= 1e3) gen2
;

exec dbms_stats.gather_table_stats(null, 't_source')

create or replace package test_plsql_caching_with_except
as
  function test_plsql_caching_with_except(s_currency_code in varchar2, s_do_excpt_on in varchar2 default 'C10') return number parallel_enable;
end;
/

create or replace package body test_plsql_caching_with_except
as
  function test_plsql_caching_with_except(s_currency_code in varchar2, s_do_excpt_on in varchar2 default 'C10') return number parallel_enable
  is
  begin
    if s_currency_code = s_do_excpt_on then
      raise_application_error(-20001, 'exception encountered');
    end if;
    --
    return to_number(substr(s_currency_code, 2));
  end;
end;
/

create table t_dest (id number(*, 0), currency_code varchar2(3), org_amount number, conv_amount number);

exec DBMS_ERRLOG.create_error_log (dml_table_name => 't_dest')

truncate table t_dest;

truncate table ERR$_T_DEST;

alter session enable parallel dml;

-- Using "currency_code_scat" as function parameter gives correct result in T_DEST
-- But column CONV_AMOUNT in ERR$_T_DEST shows some function result that shouldn't be there since the function raised an exception (reproduces in 11.2.0.4 but not 12.1.0.2)
--
-- define ccy_code = currency_code_scat

-- Using "currency_code_clust" as function parameter gives wrong result in T_DEST - rows that should go to ERR$_T_DEST
-- due to exception being raised in PL/SQL function end up in T_DEST (with some "cached" function result applied)
-- There shouldn't be any rows in T_DEST with "currency_code = 'C10'"
-- Applies to both serial and Parallel Execution, conventional and direct path insert
define ccy_code = currency_code_clust

-- Use commented, non-cached function call to see correct results
insert /*+
           append
           no_parallel
           -- parallel(n)
        */
into t_dest (id, currency_code, org_amount, conv_amount)
select id, &ccy_code, amount,
--test_plsql_caching_with_except.test_plsql_caching_with_except(&ccy_code) * amount
(select test_plsql_caching_with_except.test_plsql_caching_with_except(&ccy_code) * amount from dual)
from t_source
log errors
reject limit unlimited;

commit;

-- This is supposed to 900K
select count(*) from t_dest;

-- This is supposed to be 0
select count(*) from t_dest where currency_code = 'C10';

-- This is supposed to 100K
select count(*) from ERR$_T_DEST;

-- This is supposed to 0
select count(*) from ERR$_T_DEST where conv_amount is not null;
The second parameter to the PL/SQL function determines for which code an exception should be raised (or if at all), and hence allows reproducing different scenarios. By default it will raise an exception for code "C10" which represents 10% (100K rows) of the data in T_SOURCE. So 900K rows should end up in the destination table and those 100K rows having code "C10" should go into the error logging table.
Running the test case without the scalar subquery gets the correct result:
SQL> -- This is supposed to 900K
SQL> select count(*) from t_dest;

  COUNT(*)
----------
    900000

Elapsed: 00:00:00.70
SQL>
SQL> -- This is supposed to be 0
SQL> select count(*) from t_dest where currency_code = 'C10';

  COUNT(*)
----------
         0

Elapsed: 00:00:00.21
SQL>
SQL> -- This is supposed to 100K
SQL> select count(*) from ERR$_T_DEST;

  COUNT(*)
----------
    100000

Elapsed: 00:00:00.70
SQL>
SQL> -- This is supposed to 0
SQL> select count(*) from ERR$_T_DEST where conv_amount is not null;

  COUNT(*)
----------
         0

Elapsed: 00:00:00.04
SQL>
Use the scalar subquery, and suddendly instead of 100K rows that should be rejected only a single one gets rejected and 99.999 make it into the target table with some converted amount:
SQL> -- This is supposed to 900K
SQL> select count(*) from t_dest;

  COUNT(*)
----------
    999999

Elapsed: 00:00:00.23
SQL>
SQL> -- This is supposed to be 0
SQL> select count(*) from t_dest where currency_code = 'C10';

  COUNT(*)
----------
     99999

Elapsed: 00:00:00.20
SQL>
SQL> -- This is supposed to 100K
SQL> select count(*) from ERR$_T_DEST;

  COUNT(*)
----------
         1

Elapsed: 00:00:00.00
SQL>
SQL> -- This is supposed to 0
SQL> select count(*) from ERR$_T_DEST where conv_amount is not null;

  COUNT(*)
----------
         1

Elapsed: 00:00:00.01
SQL>
Now the critical point is the order of the column values in the column passed into the PL/SQL function. The problem can only be reproduced when using the "clustered" variant of the currency codes (column CURRENCY_CODE_CLUST in T_SOURCE). Switch to the "scattered" variant (CURRENCY_CODE_SCAT), and the (almost) correct result gets produced, at least in the target table. I say "almost" because looking closer at the rows written to the error logging table it becomes obvious that they contain a converted amount that definitely shouldn't be there - so the wrong result error already shows up here, since the row was written to the error logging table due to the PL/SQL function raising an exception, hence the converted amount should be NULL. This "wrong converted amount in the error logging table" no longer occurs in 12c (12.1.0.2), so something has changed but the problem of wrong results (rows with errors / exceptions go into the target table) is still reproducible in 12c.
The problem seems to be related to the way how the scalar subquery caching works when the same value comes again - Jonathan Lewis described this feature in "Cost Based Oracle" a long time ago. There seems to be special optimisation that avoids the cache lookup in case the same value as before is used again, like a "single value cache" on top of the actual cache. And it looks like it is this special treatment that doesn't handle correctly the case of the exception being raised in the PL/SQL function.
The test case also allows checking if other caching mechanisms like declaring the function "deterministic" (although in the real life case it isn't really hence shouldn't be used since it opens up other possibilities like building a Materialized View or a function-based index based on the PL/SQL function that potentially would lead to wrong results again then) or making use of the PL/SQL function result cache suffer from the same problem - and they don't. Both produce the correct results under all scenarios tested.
I have a more complex variant of the test case that also allows spotting more clearly the critical difference between the "scalar subquery / deterministic caching" that obviously happens in the SQL engine and the PL/SQL function result cache that is implemented in the PL/SQL engine by counting the number of times the function code gets actually executed and how many times the PL/SQL code block got executed according to the Library Cache information.
In this case here where the overhead of the actual function call is very small but it is called very frequently the PL/SQL function result cache adds much more overhead than the SQL engine caching, because the context switch to PL/SQL needs to be done for every function invocation, only to be then resolved in the PL/SQL function result cache instead of actually executing the function code.
Whereas the "scalar subquery / deterministic" cache avoids the context switch to PL/SQL and uses values from a cache maintained in the SQL engine.
So the lesser the overhead of the actual PL/SQL function code and the more frequent the function gets called, the more overhead the usage of the PL/SQL function result cache will produce in comparison to the SQL engine based caching mechanisms.
Of course the PL/SQL function result cache comes with other features that are not there with the others - like cross session / statement invocation caching that might make a big difference if a single function call causes a lot of overhead.
Sunday, June 5, 2016
Oracle Database Cloud (DBaaS) Performance Consistency - Part 1
As Oracle ACE Director I got an extended trial license for Oracle's Cloud offerings, in particular the "Database as a Service" offering. As part of the (ongoing) evaluation I try to get an idea how consistent the performance of such an service is, which might be one of the concerns one might have when considering cloud offerings in general.
For my tests I've set up a 11.2.0.4 single instance database using "4 OCPUs" (Oracle CPUs) which ends up as an Oracle Linux 6 system showing 8 CPUs *and* 8 cores of type "Intel(R) Xeon(R) CPU E5-2690 v2 @ 3.00GHz".
As edition for the database I've chosen the "Extreme Performance" Enterprise Edition which also shows up at the version banner (note the difference to regular database installations, not sure this might break some applications that don't know this banner):

The graph is supposed to show how many of the runs deviated how much from the overall median runtime, so the Y axis represents the percentage, and the X axis represents the deviation from the median runtime, for example 0.5 on the Y axis means 0.5 percent deviation from the median value

- The DBaaS service after a couple of days showed a very stable consistency pattern, only during the first four days the pattern was different:
First days:
 Remaining days:
 - For this test run no significant differences between different days could be spotted, except for the noticeable difference between the first few days and the remaining days
For my tests I've set up a 11.2.0.4 single instance database using "4 OCPUs" (Oracle CPUs) which ends up as an Oracle Linux 6 system showing 8 CPUs *and* 8 cores of type "Intel(R) Xeon(R) CPU E5-2690 v2 @ 3.00GHz".
As edition for the database I've chosen the "Extreme Performance" Enterprise Edition which also shows up at the version banner (note the difference to regular database installations, not sure this might break some applications that don't know this banner):
BANNER
-------------------------------------------------------------------------
Oracle Database 11g EE Extreme Perf Release 11.2.0.4.0 - 64bit Production
I personally find the names of the different available editions not really a good choice - as far as I understand the different editions, although being called "Standard Edition", "Enterprise Edition", "Enterprise Edition - High Performance" and "Enterprise Edition - Extreme Performance" only differentiate in the number of available and usable options, like the Diagnostics and Tuning Pack license or the In-Memory Column Store (12c), but not in the basic performance profile, like CPU speed or I/O performance (although Oracle also has an Exadata Service Cloud offering for higher demands in terms of performance). Note that Oracle also offers a "High Memory" configuration that doubles the available memory for the same number of available CPU cores.
For evaluating the performance consistency I plan to run different flavors of tests on this test environment - the first and most simple one is a straight CPU burning PL/SQL loop spawned as many times as CPUs available (so eight times for this test system here). I deliberately disabled the database Resource Manager for this test.
For comparison I ran exactly the same test on a physical test system of my own to see how the two systems compare in terms of performance consistency. The physical test system is older and slower and only has four cores available, so the test script was only spawned four times in this case.
The loop executed n times concurrently was simply this, and this was kept running for several days to get also an idea if there are noticeable differences on different days of the week:
set echo on
define thread_id = &1;
declare
n number;
begin
loop
n := 0;
for i in 1..1000000000 loop
n := n + 1;
end loop;
insert into timings(testtype, thread_id, ts) values ('PLSQL', &thread_id, systimestamp);
commit;
end loop;
end;
/
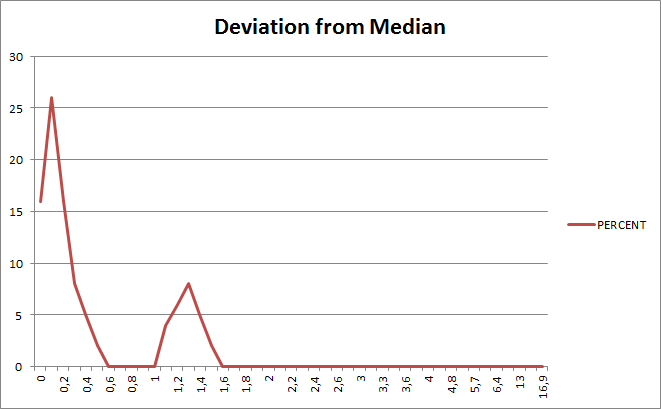
These were the results for the DBaaS service:
And these the results for the physical host:
The graph is supposed to show how many of the runs deviated how much from the overall median runtime, so the Y axis represents the percentage, and the X axis represents the deviation from the median runtime, for example 0.5 on the Y axis means 0.5 percent deviation from the median value
Looking at the results the following becomes obvious:
- The physical host provides a slightly more consistent performance (as expected), which means that it has 73% of the runs with 0.5 percent or less deviation from the median runtime, whereas the DBaaS service had "only" 64% - and it should be noted that I tried on that physical system to minimize any "noise" generated by other processes on the system. I didn't attempt to do the same for the DBaaS service, although in principle I could have tried because you get root access for this kind of service and can do whatever you want. For my physical host though in this case here it is interesting to see that there is a much more significant number of runs that deviate more than one percent from the median value, which is not the case for the DBaaS service. This also means if I change above analysis to the number of runs with 1 percent or less deviation from the median runtime, the DBaaS service (85%) actually is more consistent than my physical host (still 73%).
- The DBaaS service has some more and some more extreme outliers, but not really significant
- The overall performance consistency of the DBaaS service is pretty close to the physical host
The same graph on a per day basis (DBaaS service):
 and physical host:
- The DBaaS service after a couple of days showed a very stable consistency pattern, only during the first four days the pattern was different:
First days:
One interesting point is that in the DBaaS service the different threads showed consistent, but different runtimes, something that couldn't be seen for the physical host, where all threads showed similar runtimes. Whether this might have to do with some NUMA configuration or similar I can't tell, but it is at obvious for this test run - the Y axis represents the median duration per run per day:
DBaas service:
 Physical host:
 The next test will be a CPU bound SQL operation that performs logical I/Os only, so no physical I/O involved, whereas as final test run I plan a physical I/O bound test set up.
DBaas service:
Subscribe to:
Posts (Atom)

