For my tests I've set up a 11.2.0.4 single instance database using "4 OCPUs" (Oracle CPUs) which ends up as an Oracle Linux 6 system showing 8 CPUs *and* 8 cores of type "Intel(R) Xeon(R) CPU E5-2690 v2 @ 3.00GHz".
As edition for the database I've chosen the "Extreme Performance" Enterprise Edition which also shows up at the version banner (note the difference to regular database installations, not sure this might break some applications that don't know this banner):
BANNER
-------------------------------------------------------------------------
Oracle Database 11g EE Extreme Perf Release 11.2.0.4.0 - 64bit Production
I personally find the names of the different available editions not really a good choice - as far as I understand the different editions, although being called "Standard Edition", "Enterprise Edition", "Enterprise Edition - High Performance" and "Enterprise Edition - Extreme Performance" only differentiate in the number of available and usable options, like the Diagnostics and Tuning Pack license or the In-Memory Column Store (12c), but not in the basic performance profile, like CPU speed or I/O performance (although Oracle also has an Exadata Service Cloud offering for higher demands in terms of performance). Note that Oracle also offers a "High Memory" configuration that doubles the available memory for the same number of available CPU cores.
For evaluating the performance consistency I plan to run different flavors of tests on this test environment - the first and most simple one is a straight CPU burning PL/SQL loop spawned as many times as CPUs available (so eight times for this test system here). I deliberately disabled the database Resource Manager for this test.
For comparison I ran exactly the same test on a physical test system of my own to see how the two systems compare in terms of performance consistency. The physical test system is older and slower and only has four cores available, so the test script was only spawned four times in this case.
The loop executed n times concurrently was simply this, and this was kept running for several days to get also an idea if there are noticeable differences on different days of the week:
set echo on
define thread_id = &1;
declare
n number;
begin
loop
n := 0;
for i in 1..1000000000 loop
n := n + 1;
end loop;
insert into timings(testtype, thread_id, ts) values ('PLSQL', &thread_id, systimestamp);
commit;
end loop;
end;
/
These were the results for the DBaaS service:

And these the results for the physical host:
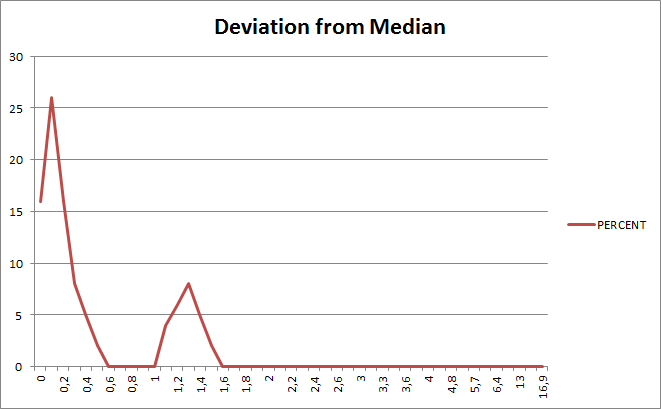
The graph is supposed to show how many of the runs deviated how much from the overall median runtime, so the Y axis represents the percentage, and the X axis represents the deviation from the median runtime, for example 0.5 on the Y axis means 0.5 percent deviation from the median value
Looking at the results the following becomes obvious:
- The physical host provides a slightly more consistent performance (as expected), which means that it has 73% of the runs with 0.5 percent or less deviation from the median runtime, whereas the DBaaS service had "only" 64% - and it should be noted that I tried on that physical system to minimize any "noise" generated by other processes on the system. I didn't attempt to do the same for the DBaaS service, although in principle I could have tried because you get root access for this kind of service and can do whatever you want. For my physical host though in this case here it is interesting to see that there is a much more significant number of runs that deviate more than one percent from the median value, which is not the case for the DBaaS service. This also means if I change above analysis to the number of runs with 1 percent or less deviation from the median runtime, the DBaaS service (85%) actually is more consistent than my physical host (still 73%).
- The DBaaS service has some more and some more extreme outliers, but not really significant
- The overall performance consistency of the DBaaS service is pretty close to the physical host
The same graph on a per day basis (DBaaS service):
 and physical host:

- The DBaaS service after a couple of days showed a very stable consistency pattern, only during the first four days the pattern was different:
First days:


One interesting point is that in the DBaaS service the different threads showed consistent, but different runtimes, something that couldn't be seen for the physical host, where all threads showed similar runtimes. Whether this might have to do with some NUMA configuration or similar I can't tell, but it is at obvious for this test run - the Y axis represents the median duration per run per day:
DBaas service:
 Physical host:
 The next test will be a CPU bound SQL operation that performs logical I/Os only, so no physical I/O involved, whereas as final test run I plan a physical I/O bound test set up.
DBaas service:


No comments:
Post a Comment
Note: Only a member of this blog may post a comment.